Recently, NotSoSecure got an opportunity to explore the working of monitoring and alerting systems as a part of a project. In this blog post, Anand Tiwari will talk about his experience and challenges faced while setting up one such monitoring and alerting system.
Insufficient Logging and Monitoring
In 2017, OWASP introduced a new risk “Insufficient Logging & Monitoring”, as a part of its triennial update in its Top 10 List of Web Application Risks. Though not a direct vulnerability, Insufficient Logging & Monitoring is listed by OWASP as effective Logging & Monitoring is an essential defence measure. Rapidly detecting anomalies by continuously monitoring log files can help companies identify and respond to attacks rapidly, potentially preventing them.
OWASP suggests that:
- There should be a system that logs auditable events from various authentication and authorization instances like failed login attempts, brute force etc. that takes place.
- An effective monitoring and alerting system must be established that can detect suspicious activities and respond in a timely fashion.
- Concerned teams must be notified in event of compromise.
- An industry standard incident response and recovery plan such as NIST 800-61 rev 2 or later must be adopted.
It doesn’t matter if we have a small or an enterprise-level organisation, one thing we have to consider is the monitoring of attacks on our application and network. We need to have a real time monitoring system in place where we can guard our application and in case someone attempts to attack, we can identify the attack and block it or take necessary actions.
To achieve this, we need a centralized system where one can continuously monitor logs, visualize data in dashboards and have a notification system where an attack can be notified.
In this blog we will discuss how to set up ModSecurity as a Web Application Firewall (WAF) in front of an application which will spool its logs to the ELK (Elasticsearch, Logstash, Kibana) stack for monitoring and ElastAlert for alerting. This could be used to feed into an existing SIEM(Security Incident and Event Monitoring) solution, or as a stand alone proactive monitoring system using open source solutions.
Workflow
The high-level workflow of continuous monitoring and alerting system using ModSecurity and ELK can be described as follows:
- Implement ModSecurity WAF.
- Analyze ModSecurity WAF logs for any OWASP (Open Web Application Security Project) top 10 Risk.
- Analyze and visualize using ELK stack.
- Monitor alerting attack patterns and source IP.
The diagrammatic representation of monitoring and alerting using ModSecurity and ELK in a network will be as shown below:
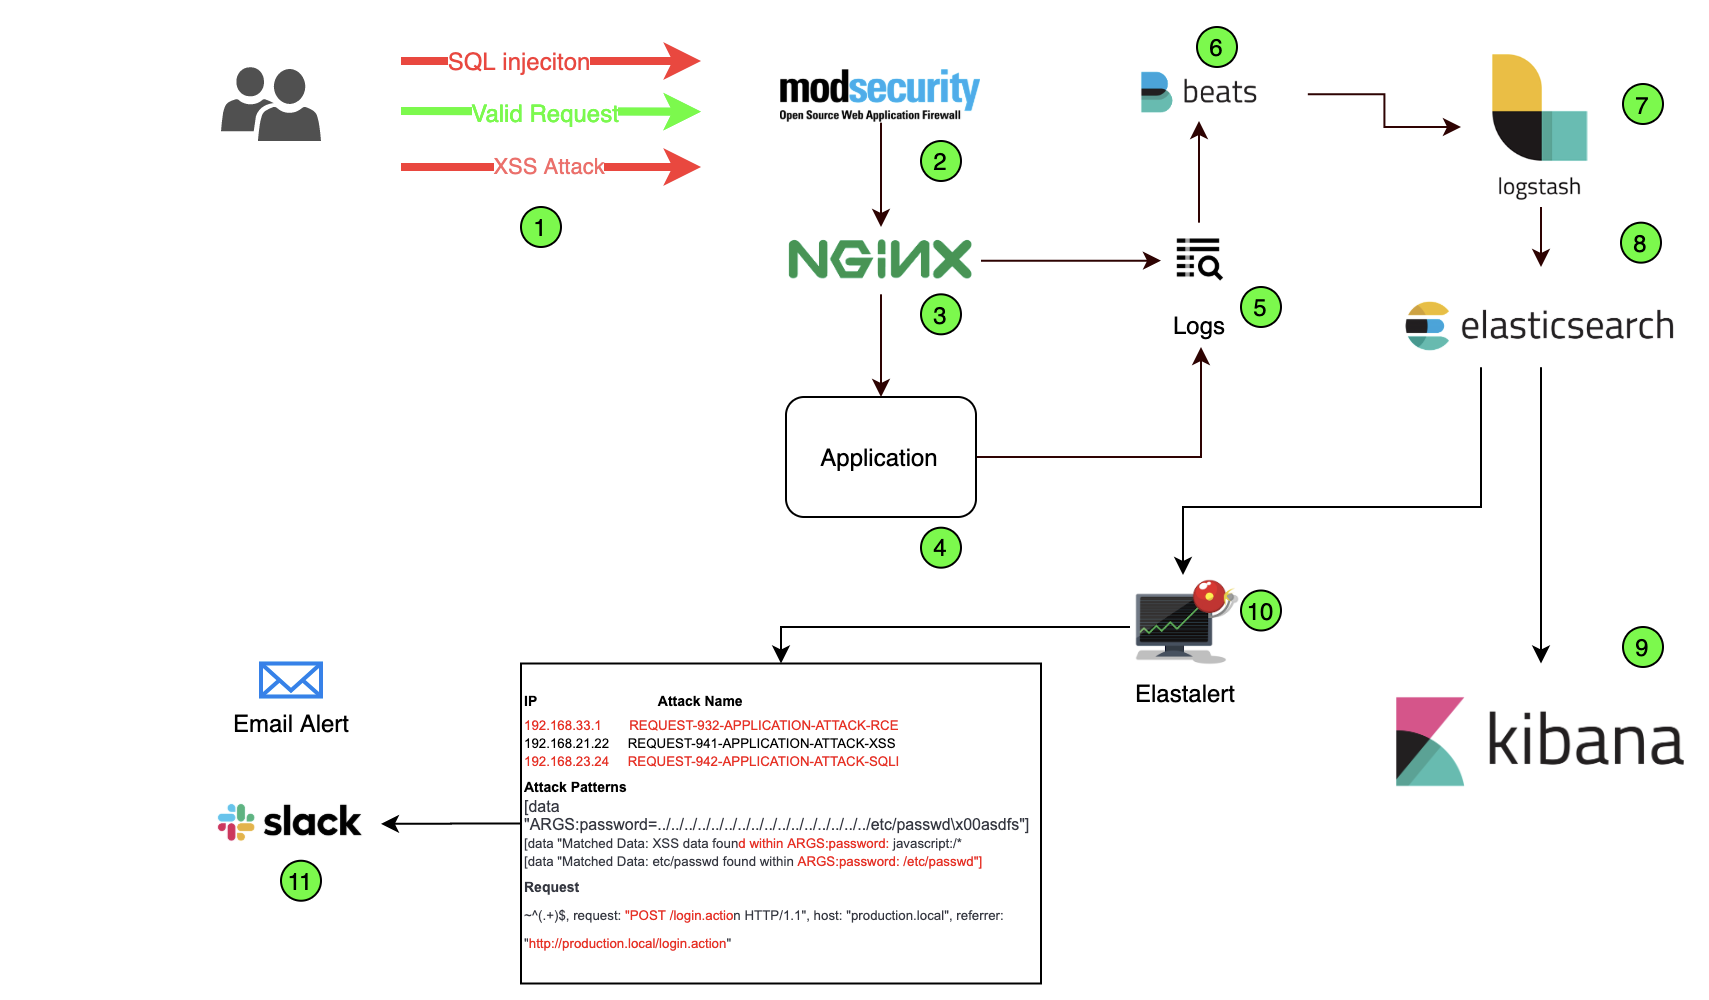
The working/role of numbered entities from the diagram is as below:
- Malicious requests blocked by WAF.
- ModSecurity running as WAF.
- Configured Nginx proxy server.
- Web application hosted on server.
- Logs generated by WAF through Nginx and application logs.
- Beats: ships logs from the server to Logstash
- Logstash: an open source data processing pipeline that ingests data from multiple sources.
- Elasticsearch: stores, searches, and analyzes data with ease at scale.
- Kibana: visualizes Elasticsearch data and gives options to configure dashboards for required information.
- ElastAlert is an open-source framework, for alerting on given patterns from data in Elasticsearch.
- Alerts received on Email/other communication channels.
Let us now talk about each entity in detail.
ModSecurity
ModSecurity is a WAF(Web Application Firewall), an open source toolkit, that provides web application defenders visibility into HTTP traffic and advanced protection against attacks.
Good references for setting up ModSecurity WAF as a Nginx reverse proxy:
Once installed, ModSecurity will generate a log file that contains all the blocked requests. There are basically three log files which will be configured into Nginx and ModSecurity configuration files:
- Error Logs
- Debug Logs
- Audit Logs
Error Logs
Error logs are generated when errors or any malicious attempts are encountered on the server. Since we have configured our setup with Nginx, all the error logs (including Nginx errors) are generated in the same file “error.log” which is by default located in the following path:
/var/log/nginx/
Debug Logs
Debug logs are for debugging purposes and will be useful for troubleshooting. It can be enabled through the “modsecurity.conf” file.
Audit Logs
Audit logs contain detailed information about the logs which are generated when ModSecurity detects a malicious event and contains useful information about the system client request including the client header and data payload, by default it is not enabled and it can be configured through the “modsecurity.conf” configuration file.
Here, we are going to focus only on “error.log” and parse this information for our analysis.
Elasticsearch, Logstash, Kibana (ELK)

Let us understand the role of Filebeat and ELK:
Filebeat - Filebeat is responsible for forwarding all the logs to Logstash, which can further pass it down the pipeline. It’s lightweight, supports SSL and TLS encryption and is extremely reliable.
Logstash - Logstash is a tool used to parse logs and send them to Elasticsearch. It is powerful and creates a pipeline and indexing events or logs. It can be used in the Elasticsearch ecosystem.
Elasticsearch - Its a highly scalable open-source analytics engine. It allows us to store, search and analyze data quickly. It’s generally useful when we work on complex search features and requirements. Also it has capability to provide a distributed system on top of Lucene Standard Analyzer for indexing.
Kibana - This is a UI tool that interacts with Elasticsearch clusters and visualizes Elasticsearch data.
Analyzing ModSecurity Error Logs
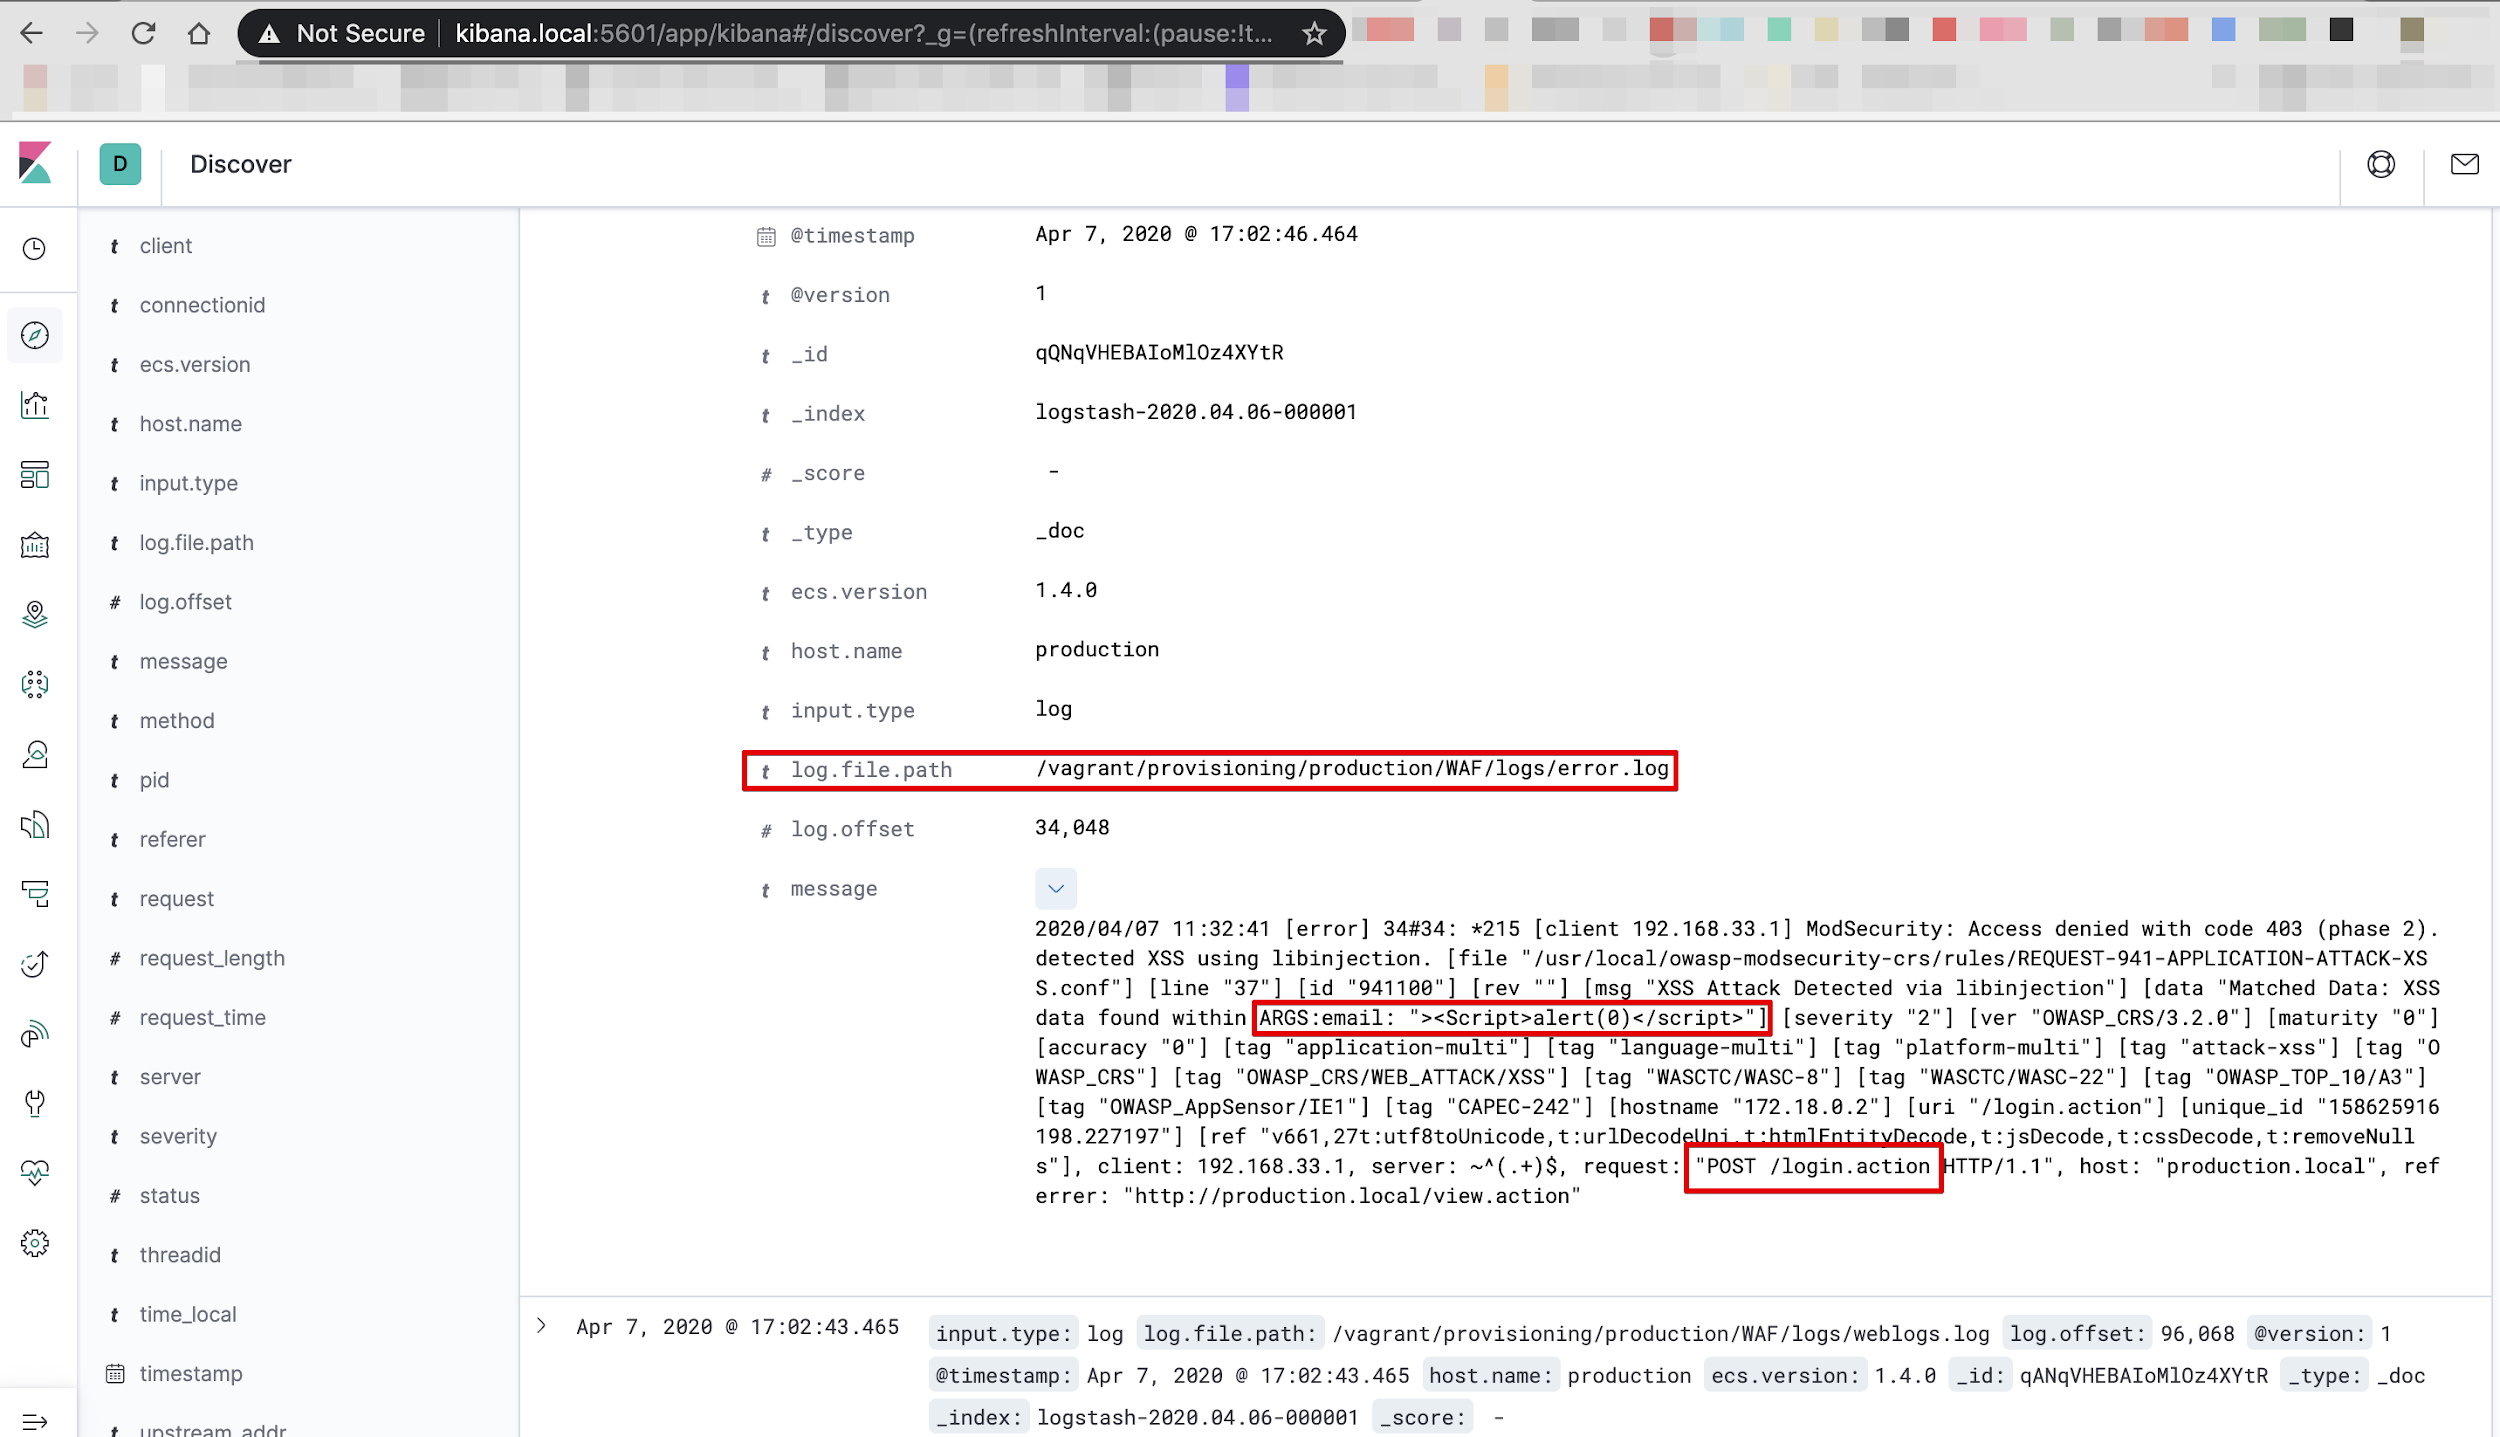
Let us now analyze the logs and understand all the parameters that are useful in creating monitoring visualization.
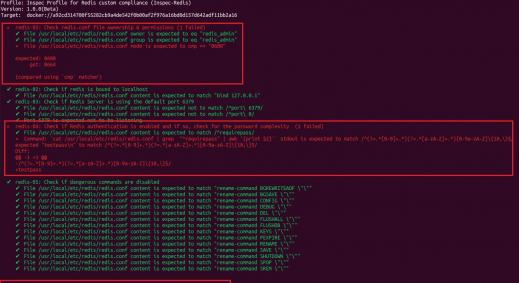
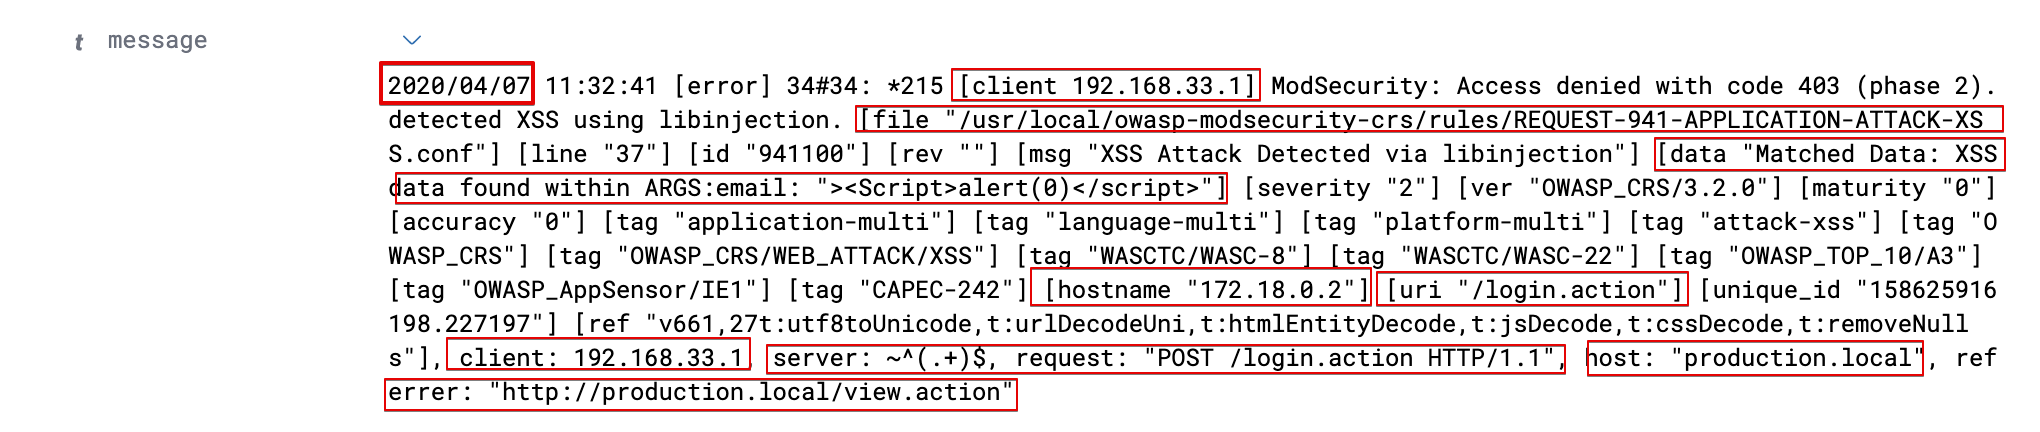
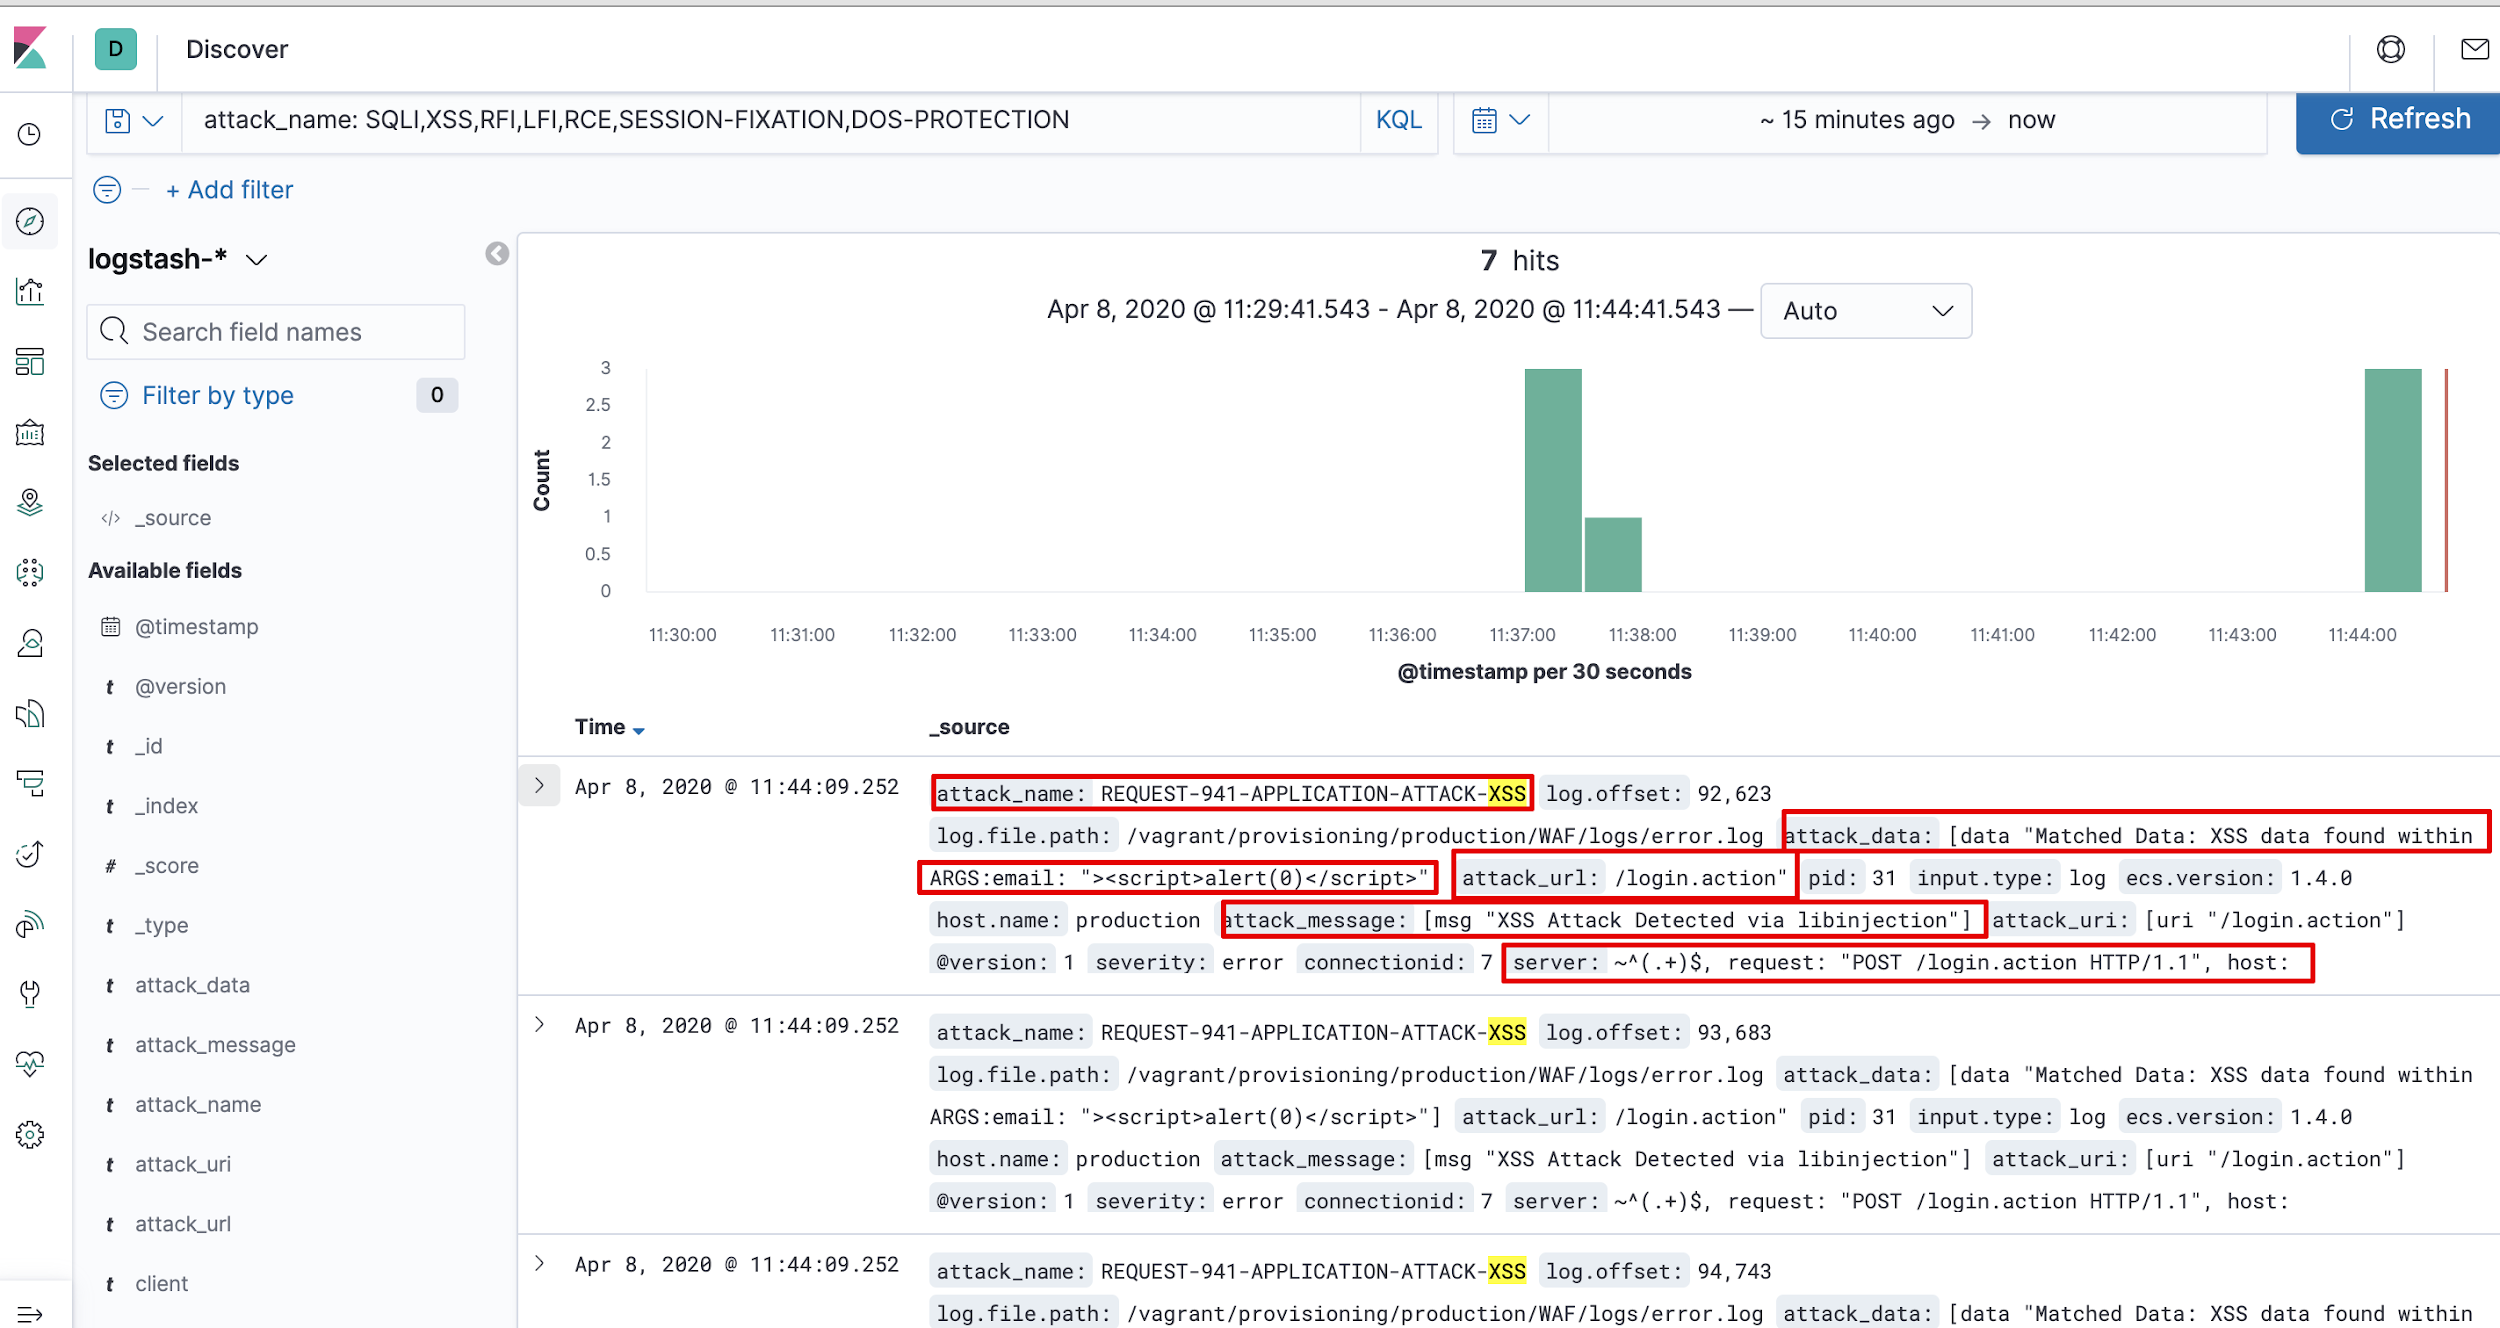
A sample attack error log is shown in image below.
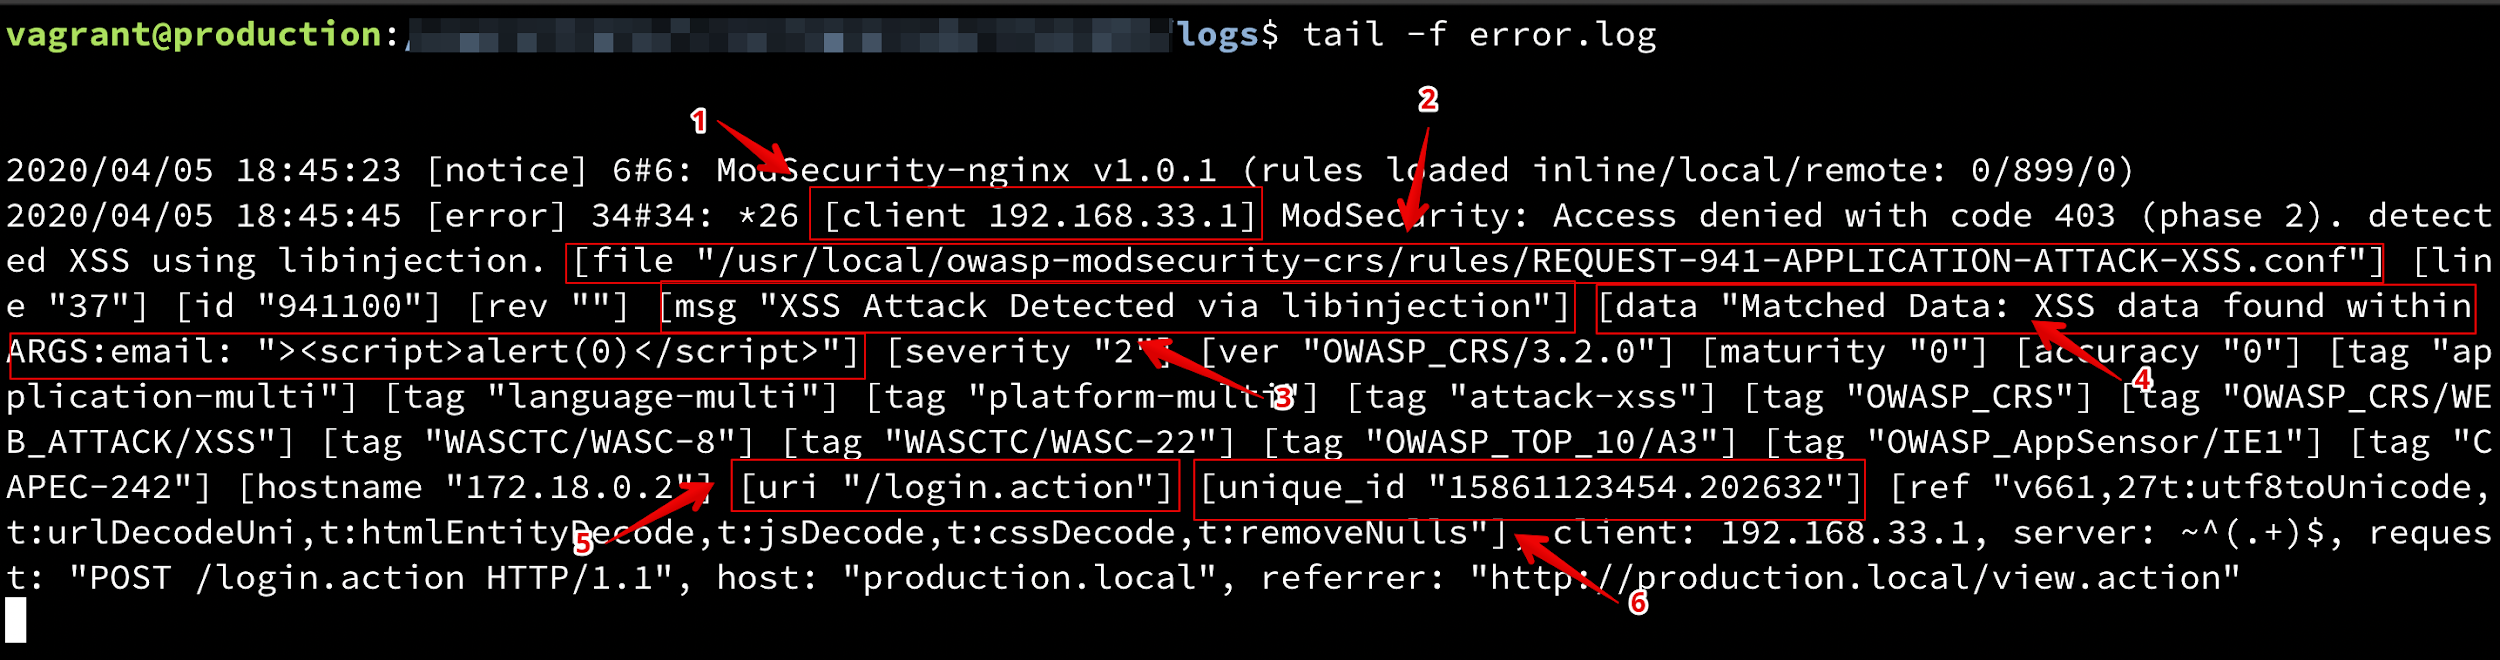
Each numbered section from the screenshot above is explained below:
- The first thing we need is the client IP address in which the request was generated.
- The next important information is the ModSecurity configuration file path in which ModSecurity defines the rule for attacks. The attack name will be extracted from the path. In the above image, the file path is as following:
/usr/local/owasp-modsecurity-crs/rules/REQUEST-941-APPLICATION-ATTACK-XSS.conf
- Next information is a message generated by ModSecurity that will be useful for us in future work.
- Data containing parameters and payload of attack.
- The most important - the URI which we extract from log.
- Unique_id values for tracking purpose.
Configuring ELK
You can configure Filebeat, Elasticsearch, Logstash and Kibana in your system by referring to the blog post written by Rohit Salecha:
Practical DevOps - Continuous Monitoring using Elasticsearch Logstash Kibana Filebeat
Configure Logs with Filebeat
Once Filebeat is installed, we’ll need to provide logs into the Filebeat configuration file so that it can ship logs to Logstash. Further, Logstash will send them to Elasticsearch.
Filebeat.yml - configuration file:
filebeat.config.modules:
  path: ${path.config}/modules.d/*.yml
filebeat.modules:
- module: logstash
 log:
   enabled: true
filebeat.inputs:
- type: log
 enabled: true
 paths:
  /etc/log/nginx/error.log
output.logstash:
 enabled: true
 hosts: logstash_server
ssl.enabled: false
Configuring Logstash
Logstash configuration files are in JSON-format, and reside at “/etc/logstash/conf.d”. The configuration file consists of three sections: inputs, filters, and outputs.
We created a configuration file “beats-input.conf” and then we set up our “Filebeat” input:
beats-input.conf:
input {
beats {
port => 5044
codec => "json"
     }
}
Filter {
        if [message] =~ "\A\{.+\}\z" {
   json {
     source => "message"
     target => "httpRequest"
   }
   mutate {
     remove_field => [ "json", "message" ]
   }
}
mutate {
          remove_field => [ "json", "agent" ]
          remove_field => [ "json", "tags" ]
          remove_field => [ "json", "thread_name" ]
    }
}
output {
   elasticsearch {
     hosts => [“elasticsearch_server:9200”]
     manage_template => false
     index => "logstash-%{+YYYY.MM.dd}"
  }
}
Feeding Data into Elasticsearch
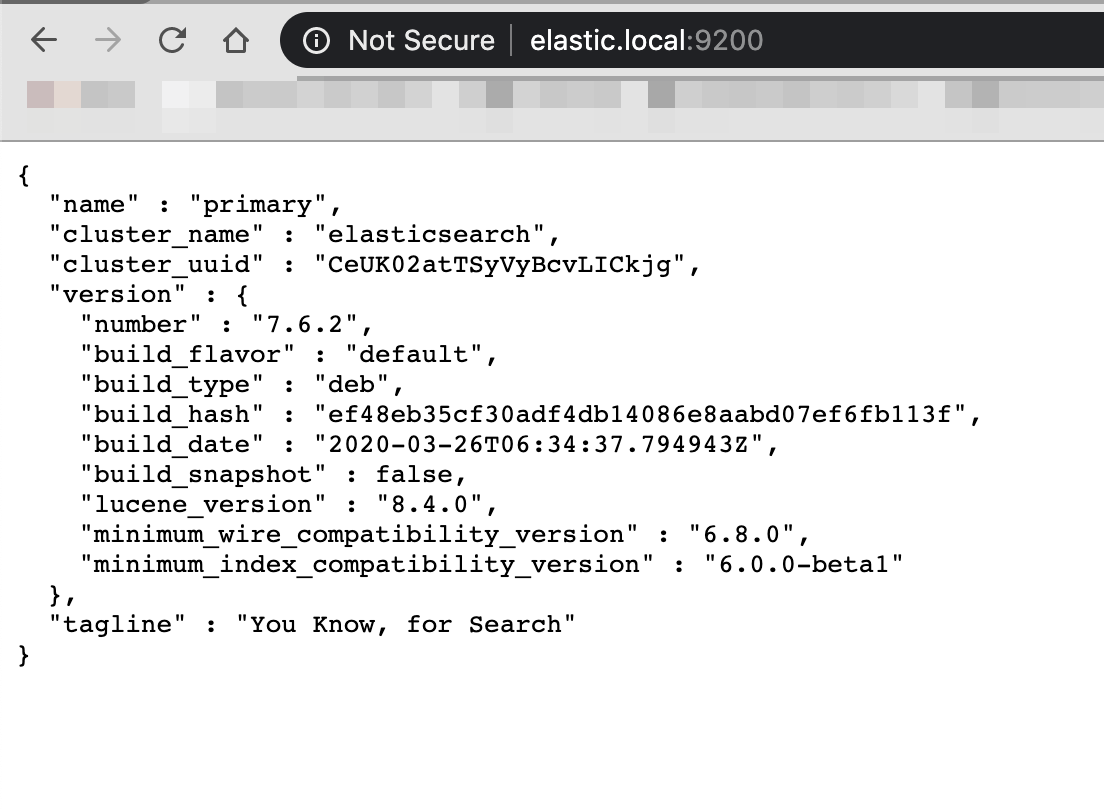
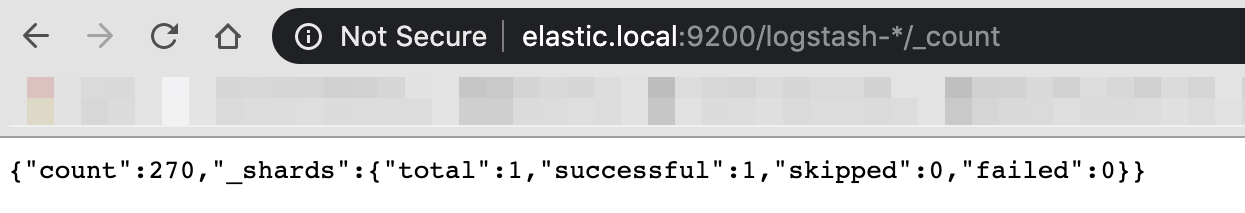
Once everything is set, the data is parsed and sent into the Elasticsearch server, which will index and analyze data quickly. Next in line is the setup of Elasticsearch with Kibana for visualization.
Setting up Kibana
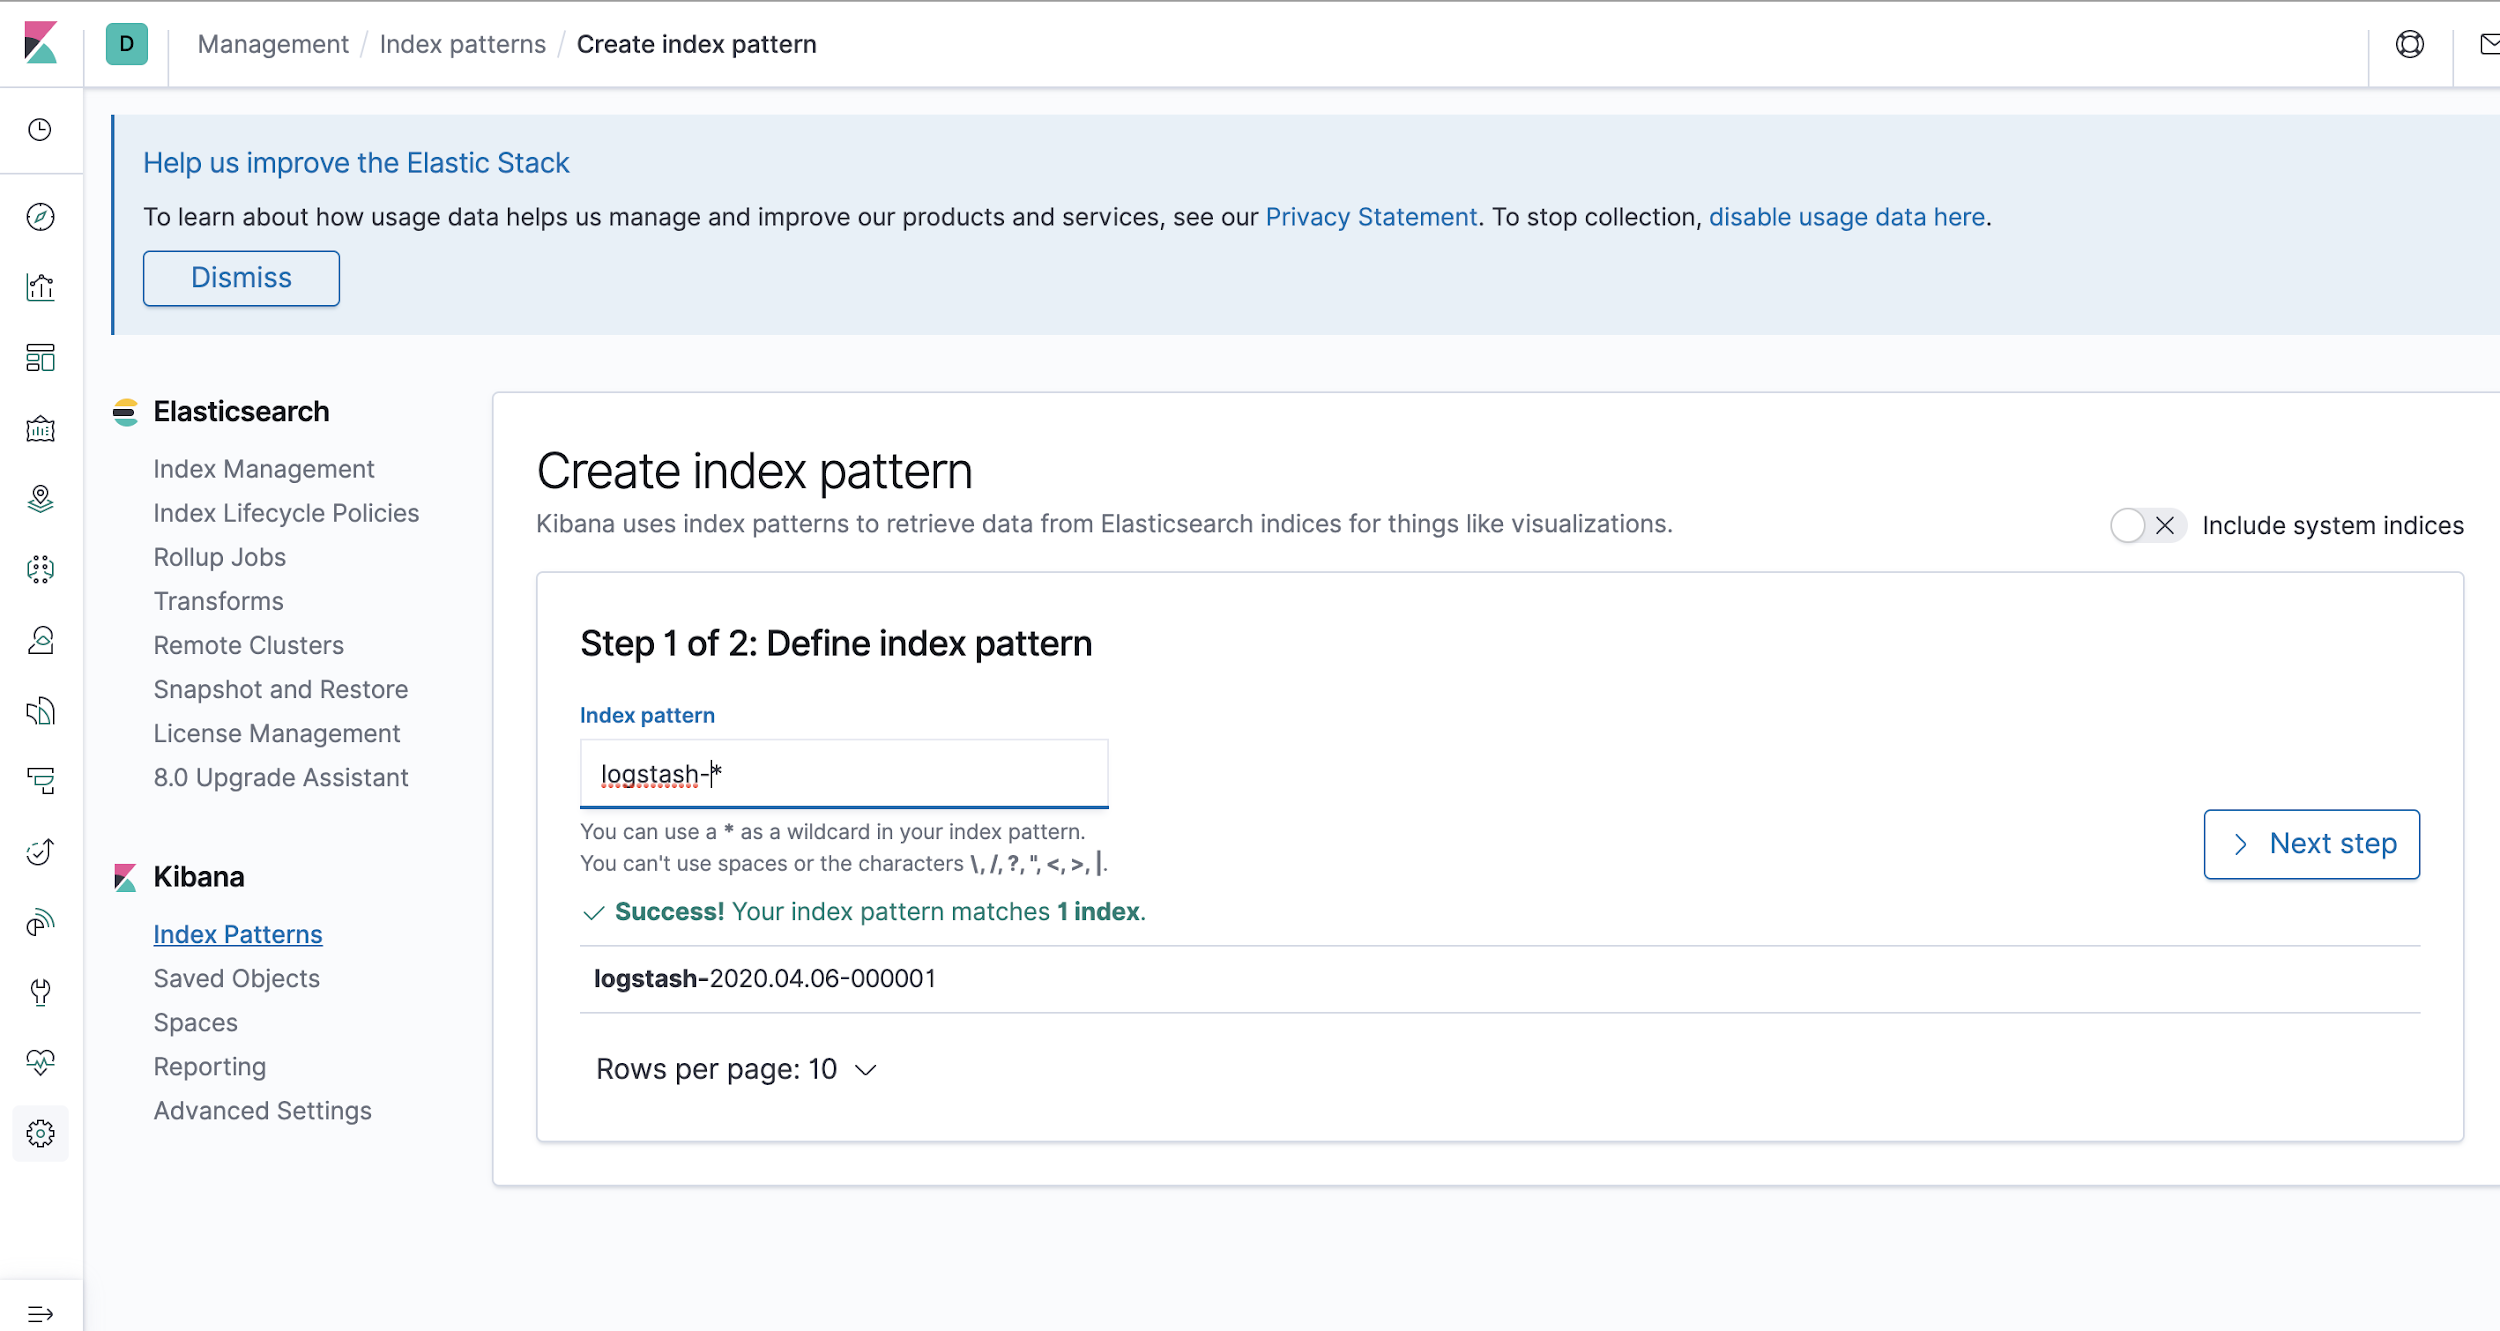
In order to grab data from Elasticsearch we need to first create an “Index pattern” in Kibana and follow the steps as shown in images below:
Step 1: Create a index pattern by defining index pattern as logstash-* in the index pattern field.
Step 2: Next, provide @timestamp in the time filter field, this will ensure to filter your data by time.
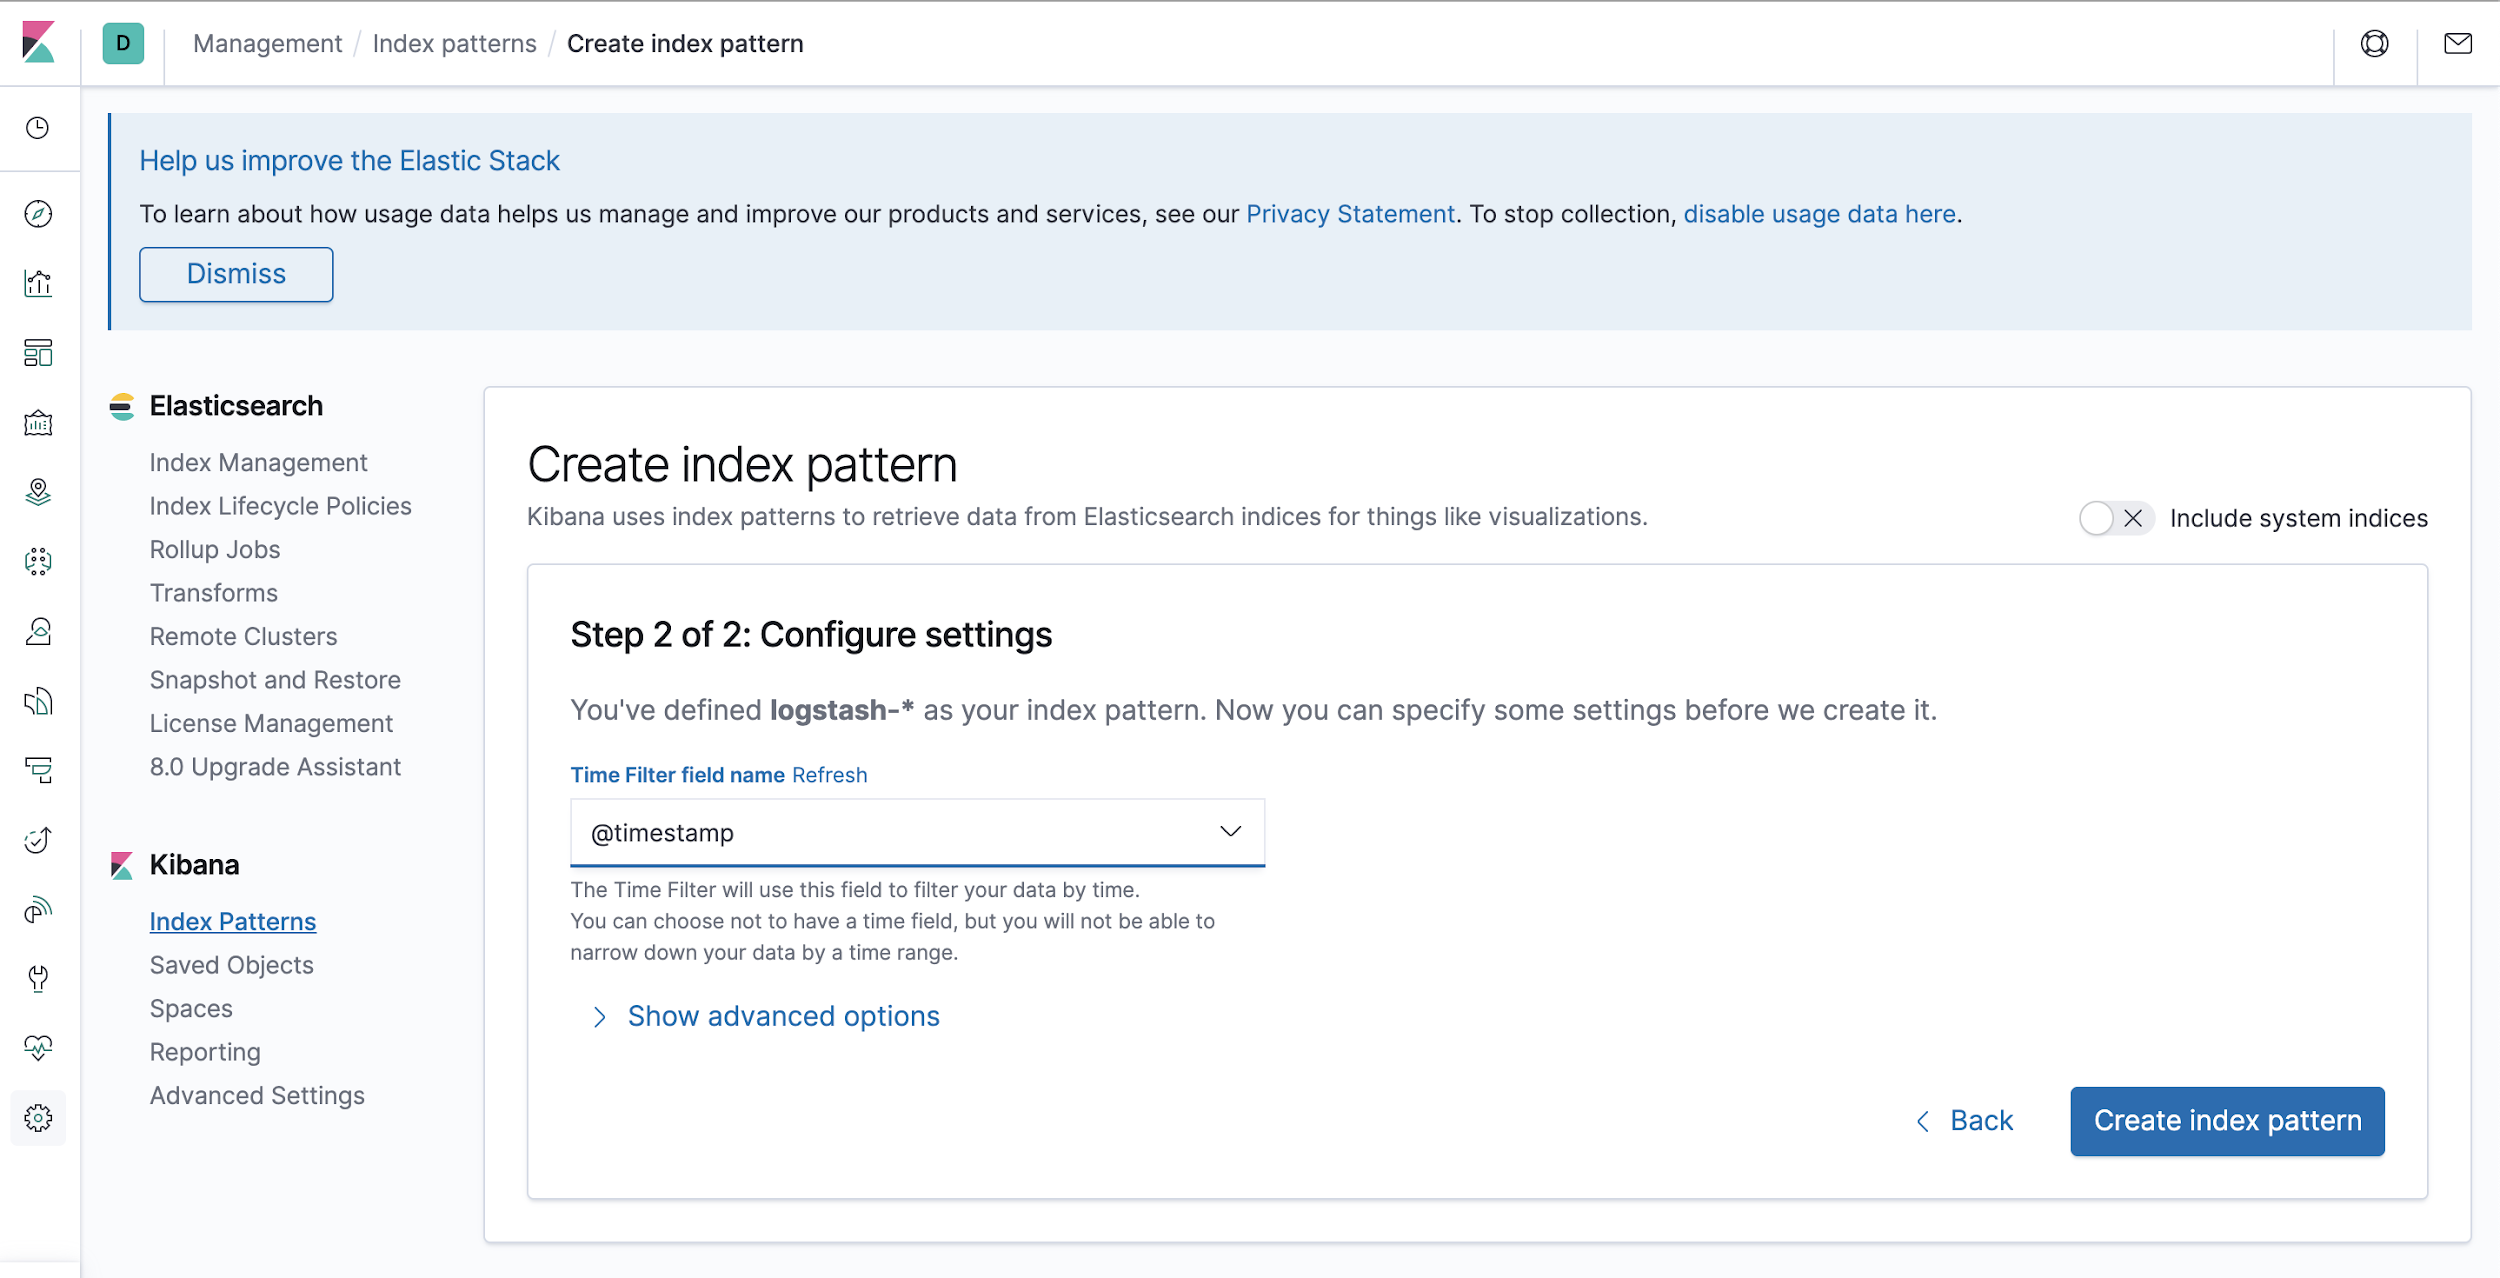
Step 3: Click on the “Discovery” icon to view your logs.
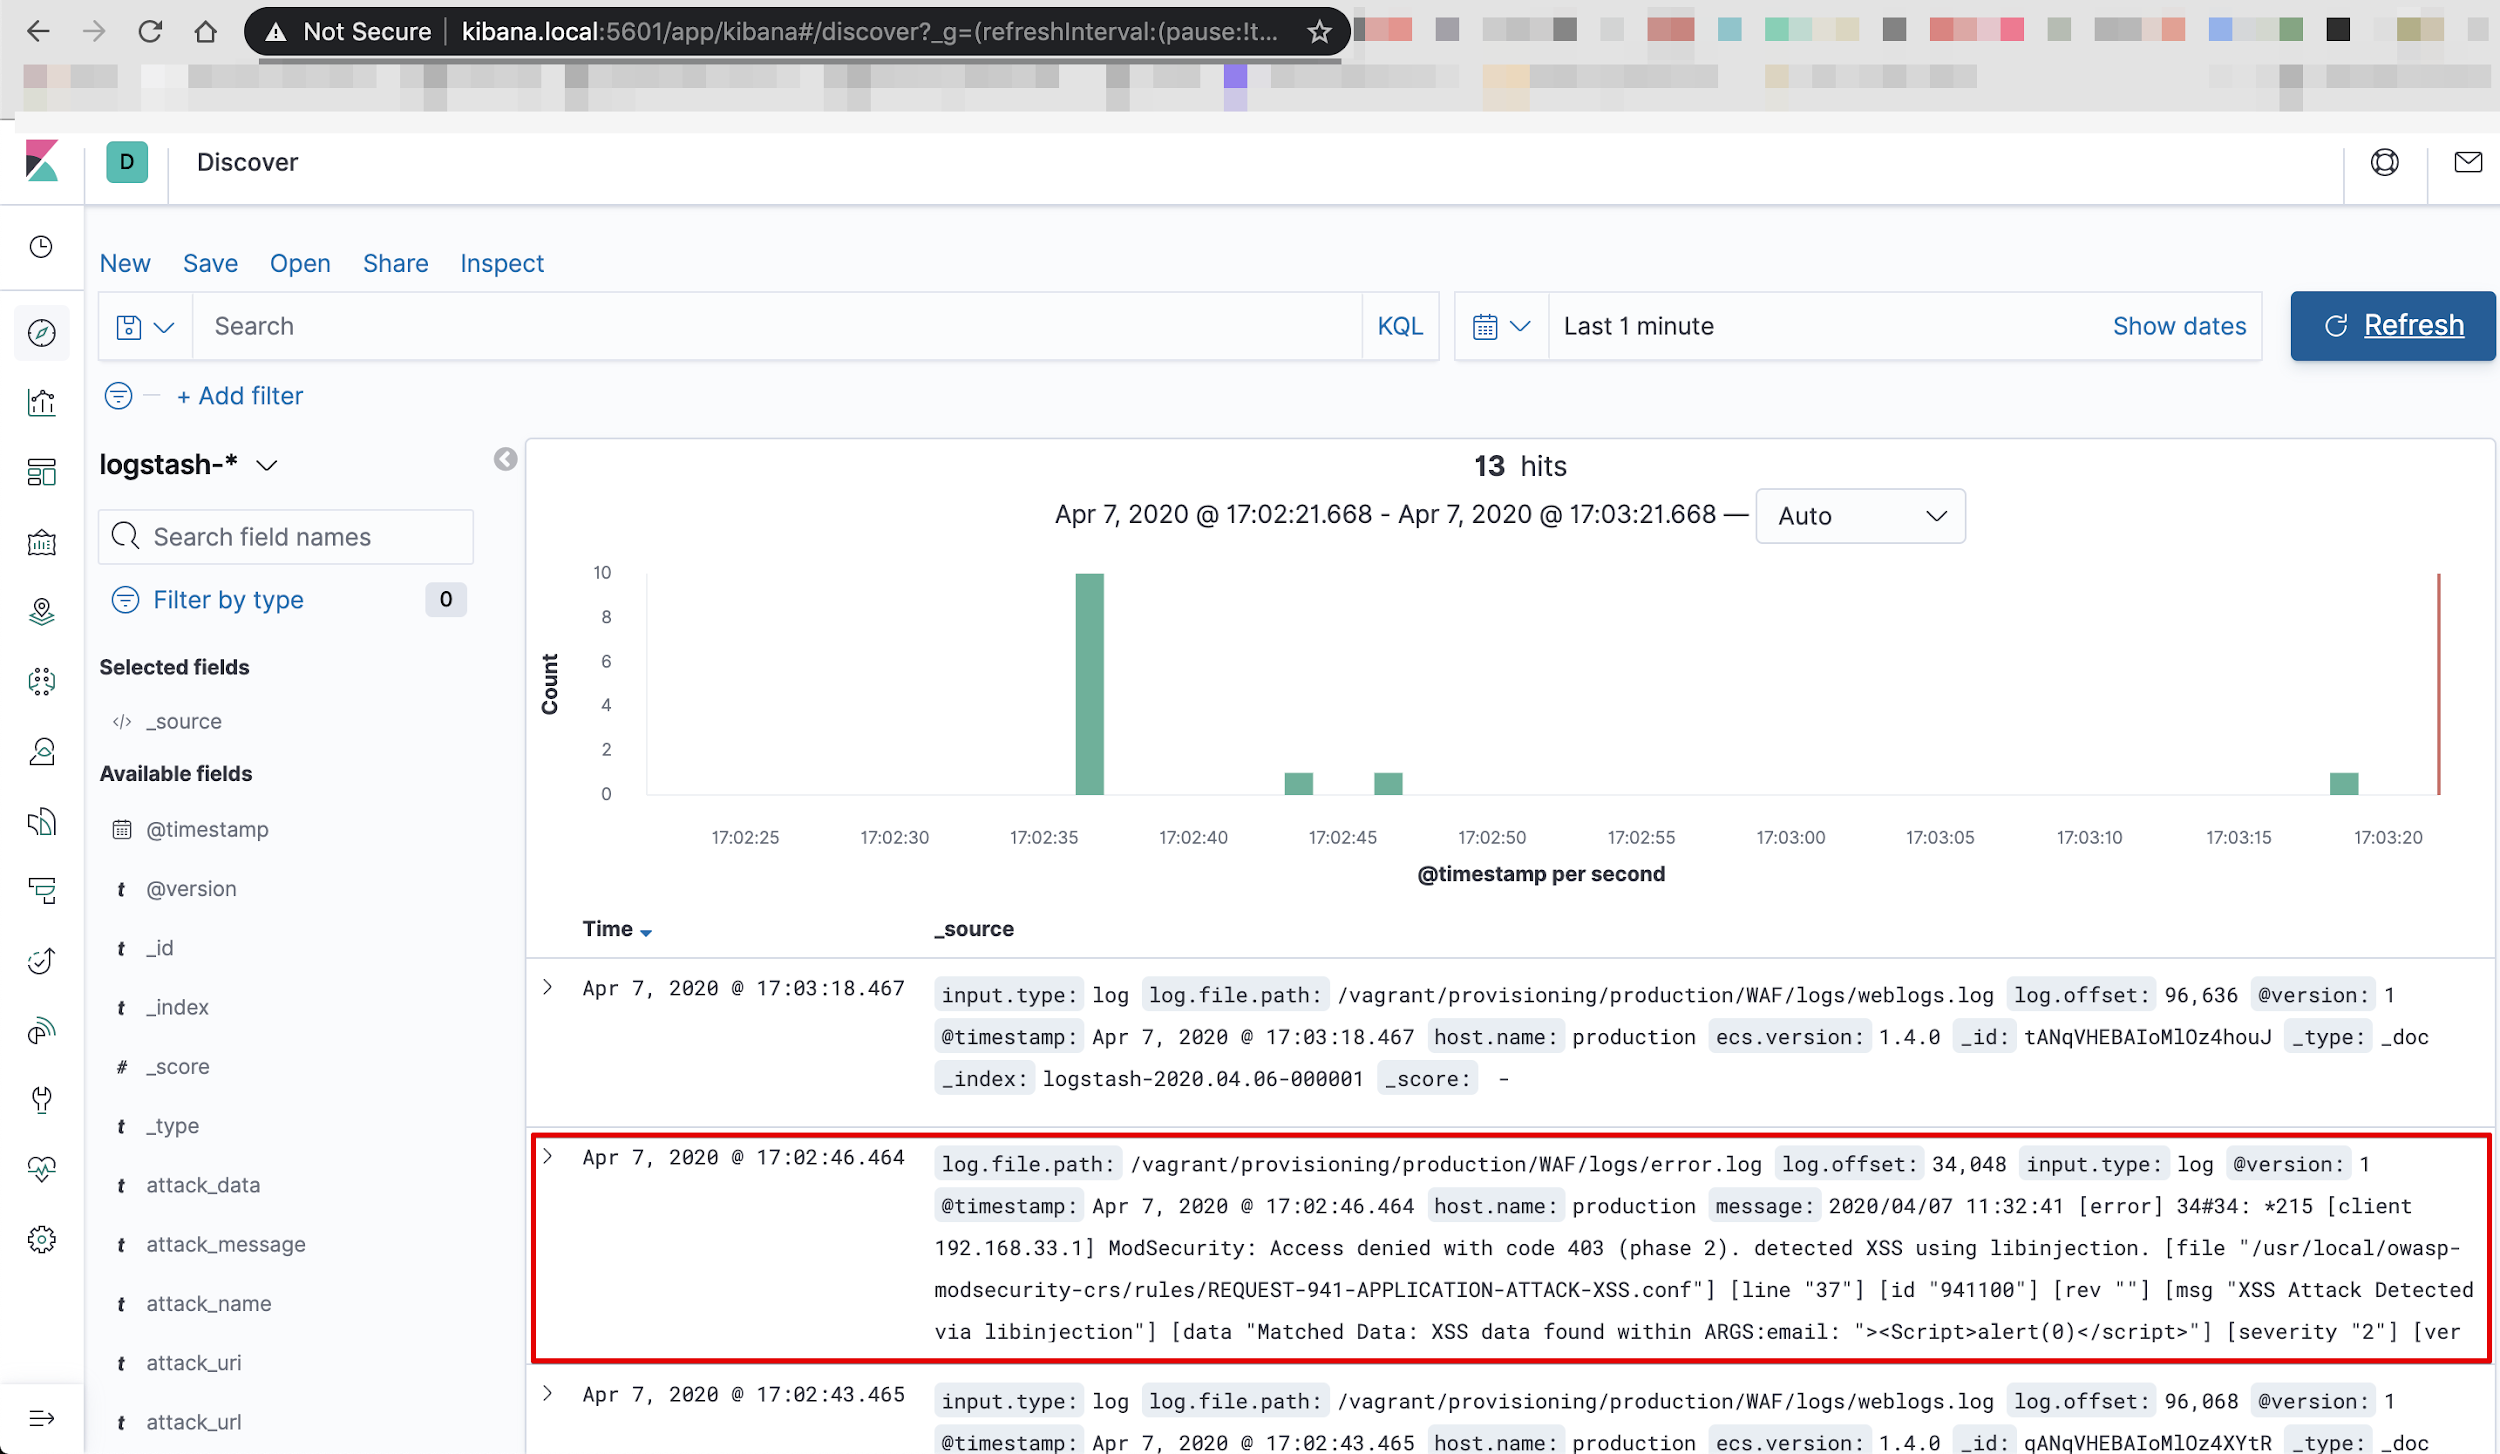
You should see all WAF error logs reflecting in the message field.
ModSecurity Logs for Kibana Visualization
After feeding logs inside Elasticsearch, we will segregate individual information (mentioned below) as index so that we can visualize required information on the dashboard.
We need the below information from logs on our dashboard:
- Client IP Address
- Attack Request
- Attack Name
- Attack Pattern (Payloads)
- Attack URL
When logs are sent from Logstash to Elasticsearch and rendered in Kibana, the data is sent in an unstructured manner in the “message” field. Querying for meaningful information in such a situation will be cumbersome as all of the log data is stored under one key. Log messages should be organized better. Hence we make use of Grok.
Logstash Grok Filter Plugin
Grok is a filter plugin in Logstash, it parses unstructured data into structured and queryable data. It uses text patterns to match lines in log files.
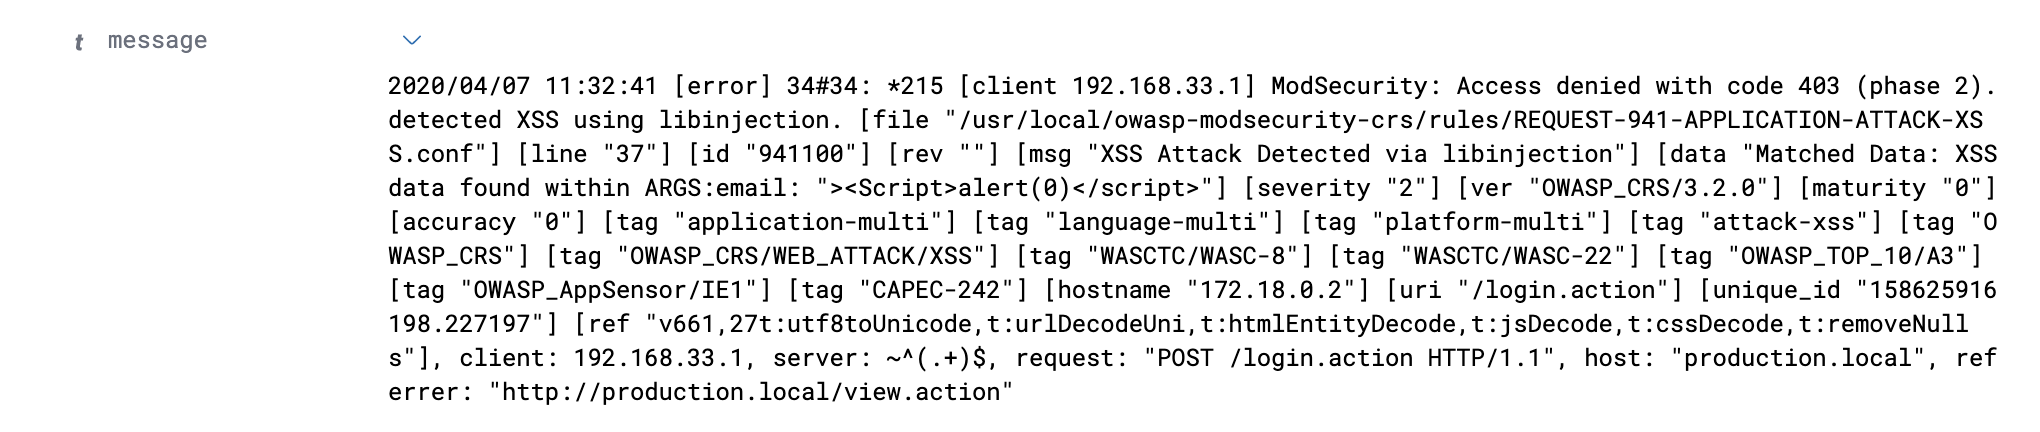
If you take a closer look at the raw data, you can see that it’s actually made up of different parts, each separated by a space.
Let’s take advantage of a Logstash Grok filter and create structured data using Grok filter patterns. Logstash Grok filter comes with over a 100 built in patterns for structuring unstructured data.
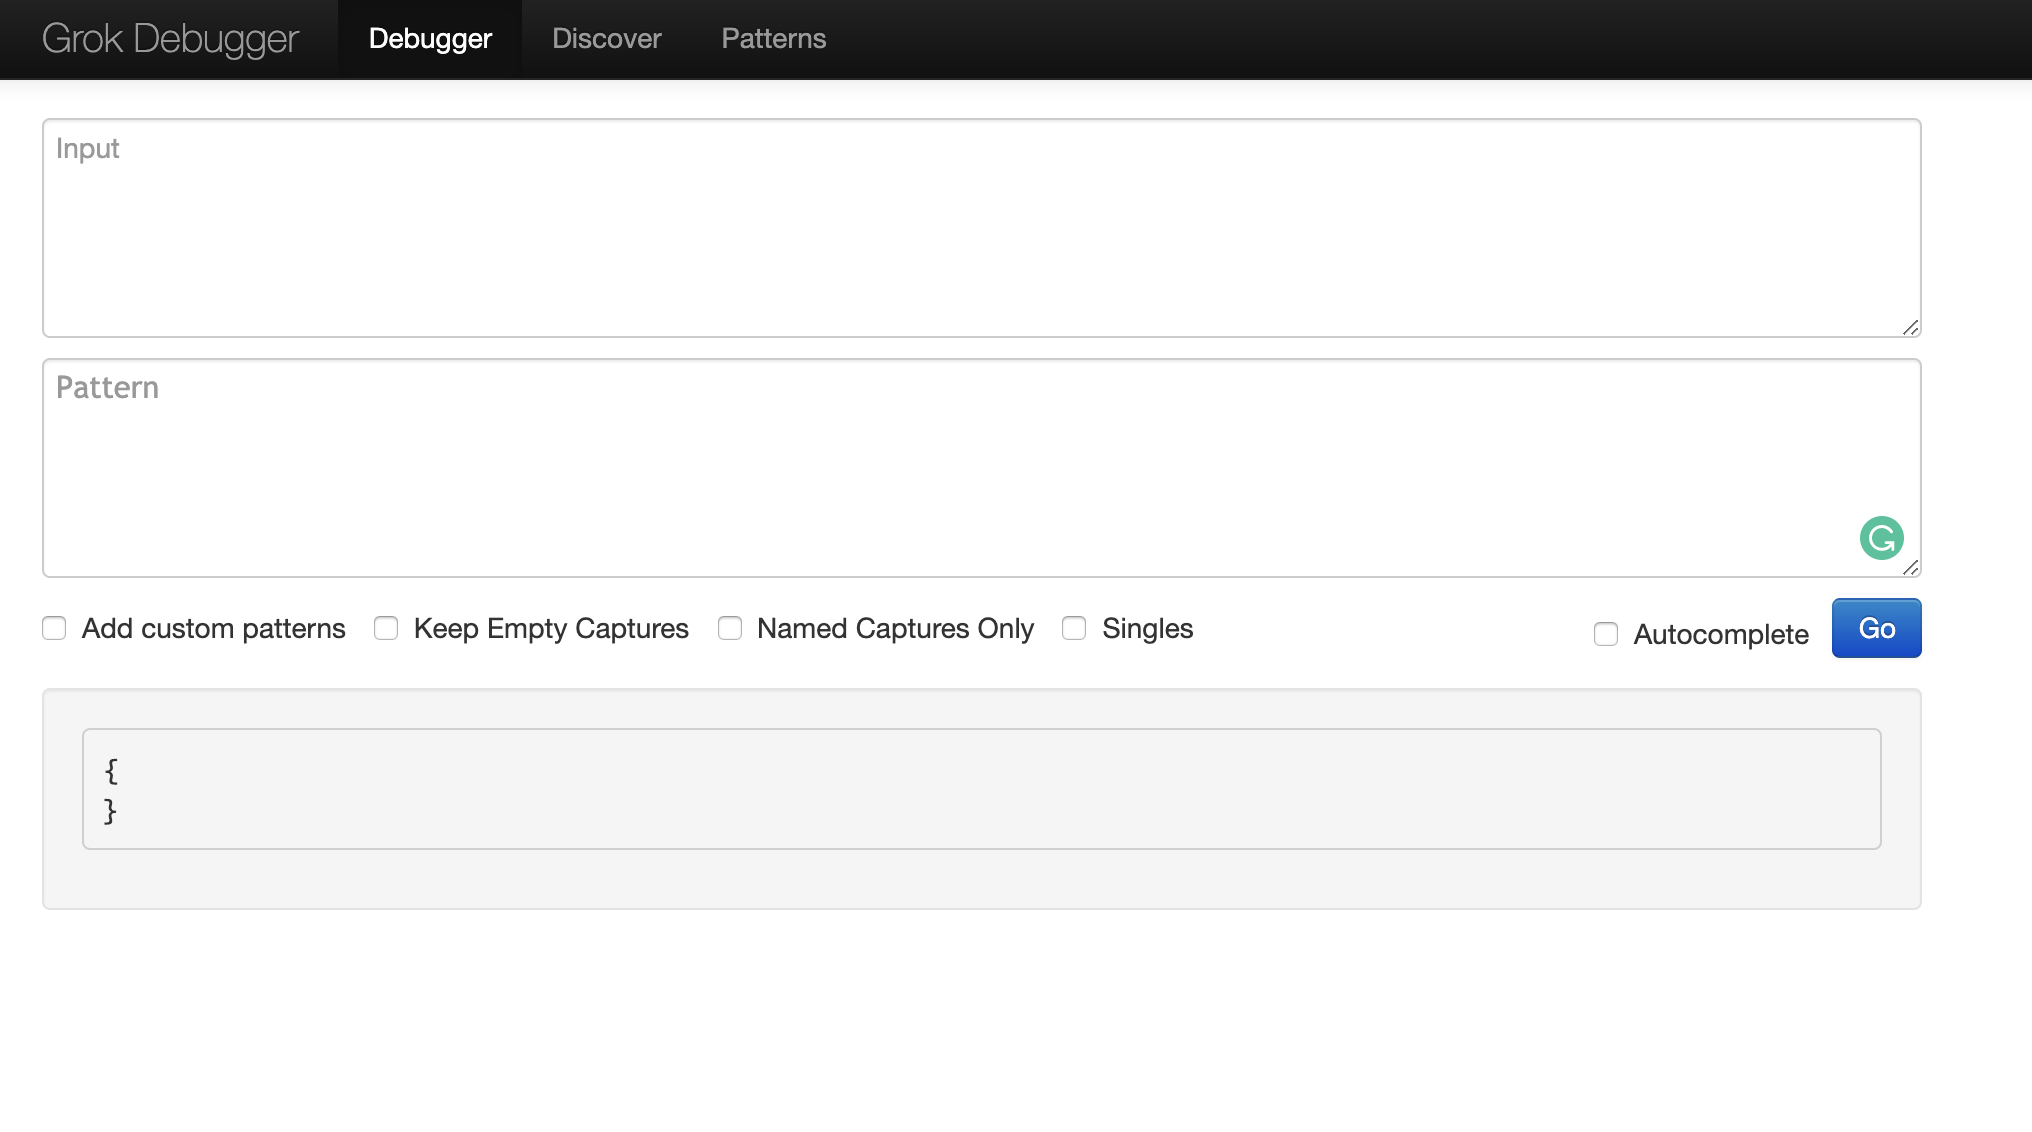
Since we had no luck with inbuilt patterns for our modsecurity “error.log” data, we built a custom Grok pattern using an online tool called Grok debugger and some useful Grok patterns.
Custom Patterns.
Grok supports regular expressions. The regular expression library used by Grok is Oniguruma, for more details you can visit Grok filter plugin site.
The use of oniguruma regular expressions will let you match a piece of text and save it as a field, syntax:
(?<field_name>the pattern here)

First let’s filter the timestamp from the message data using the following syntax:
(?<timestamp>%{YEAR}[./]%{MONTHNUM}[./]%{MONTHDAY} %{TIME})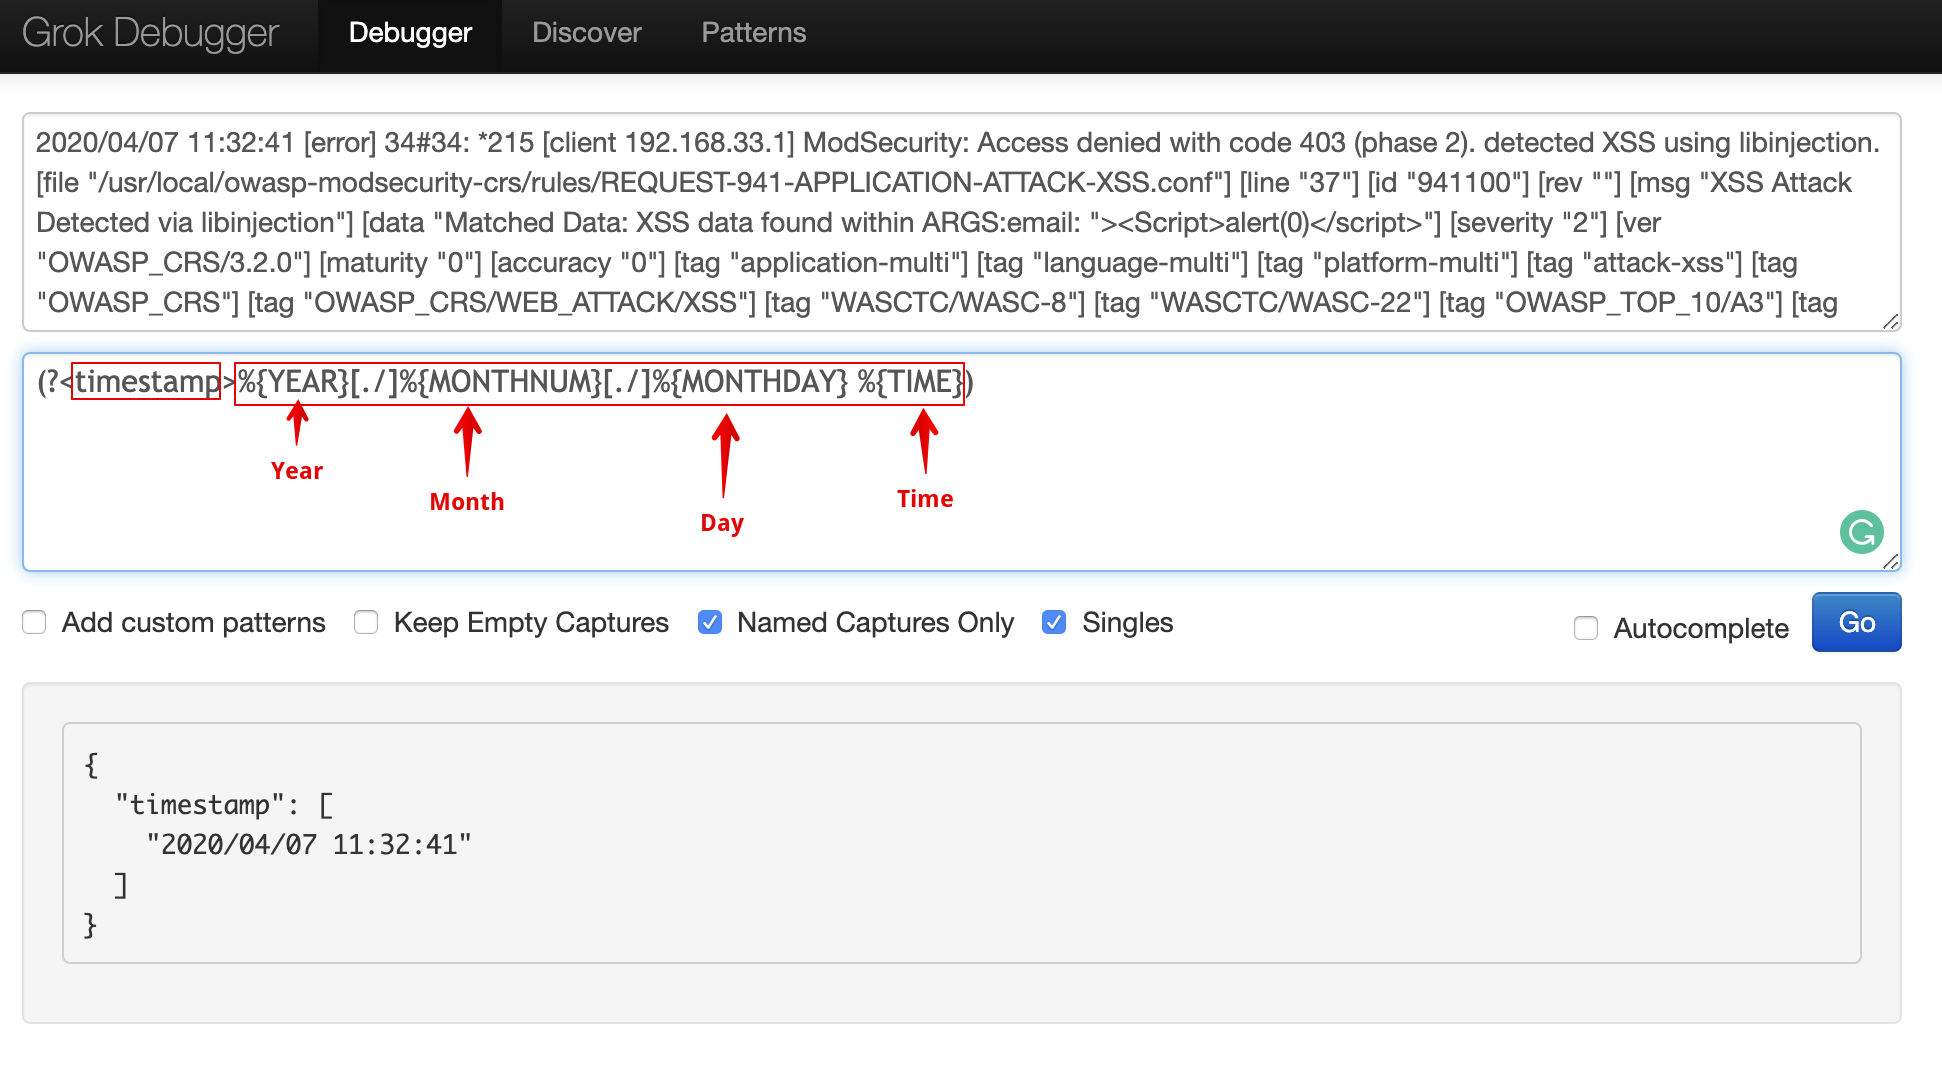
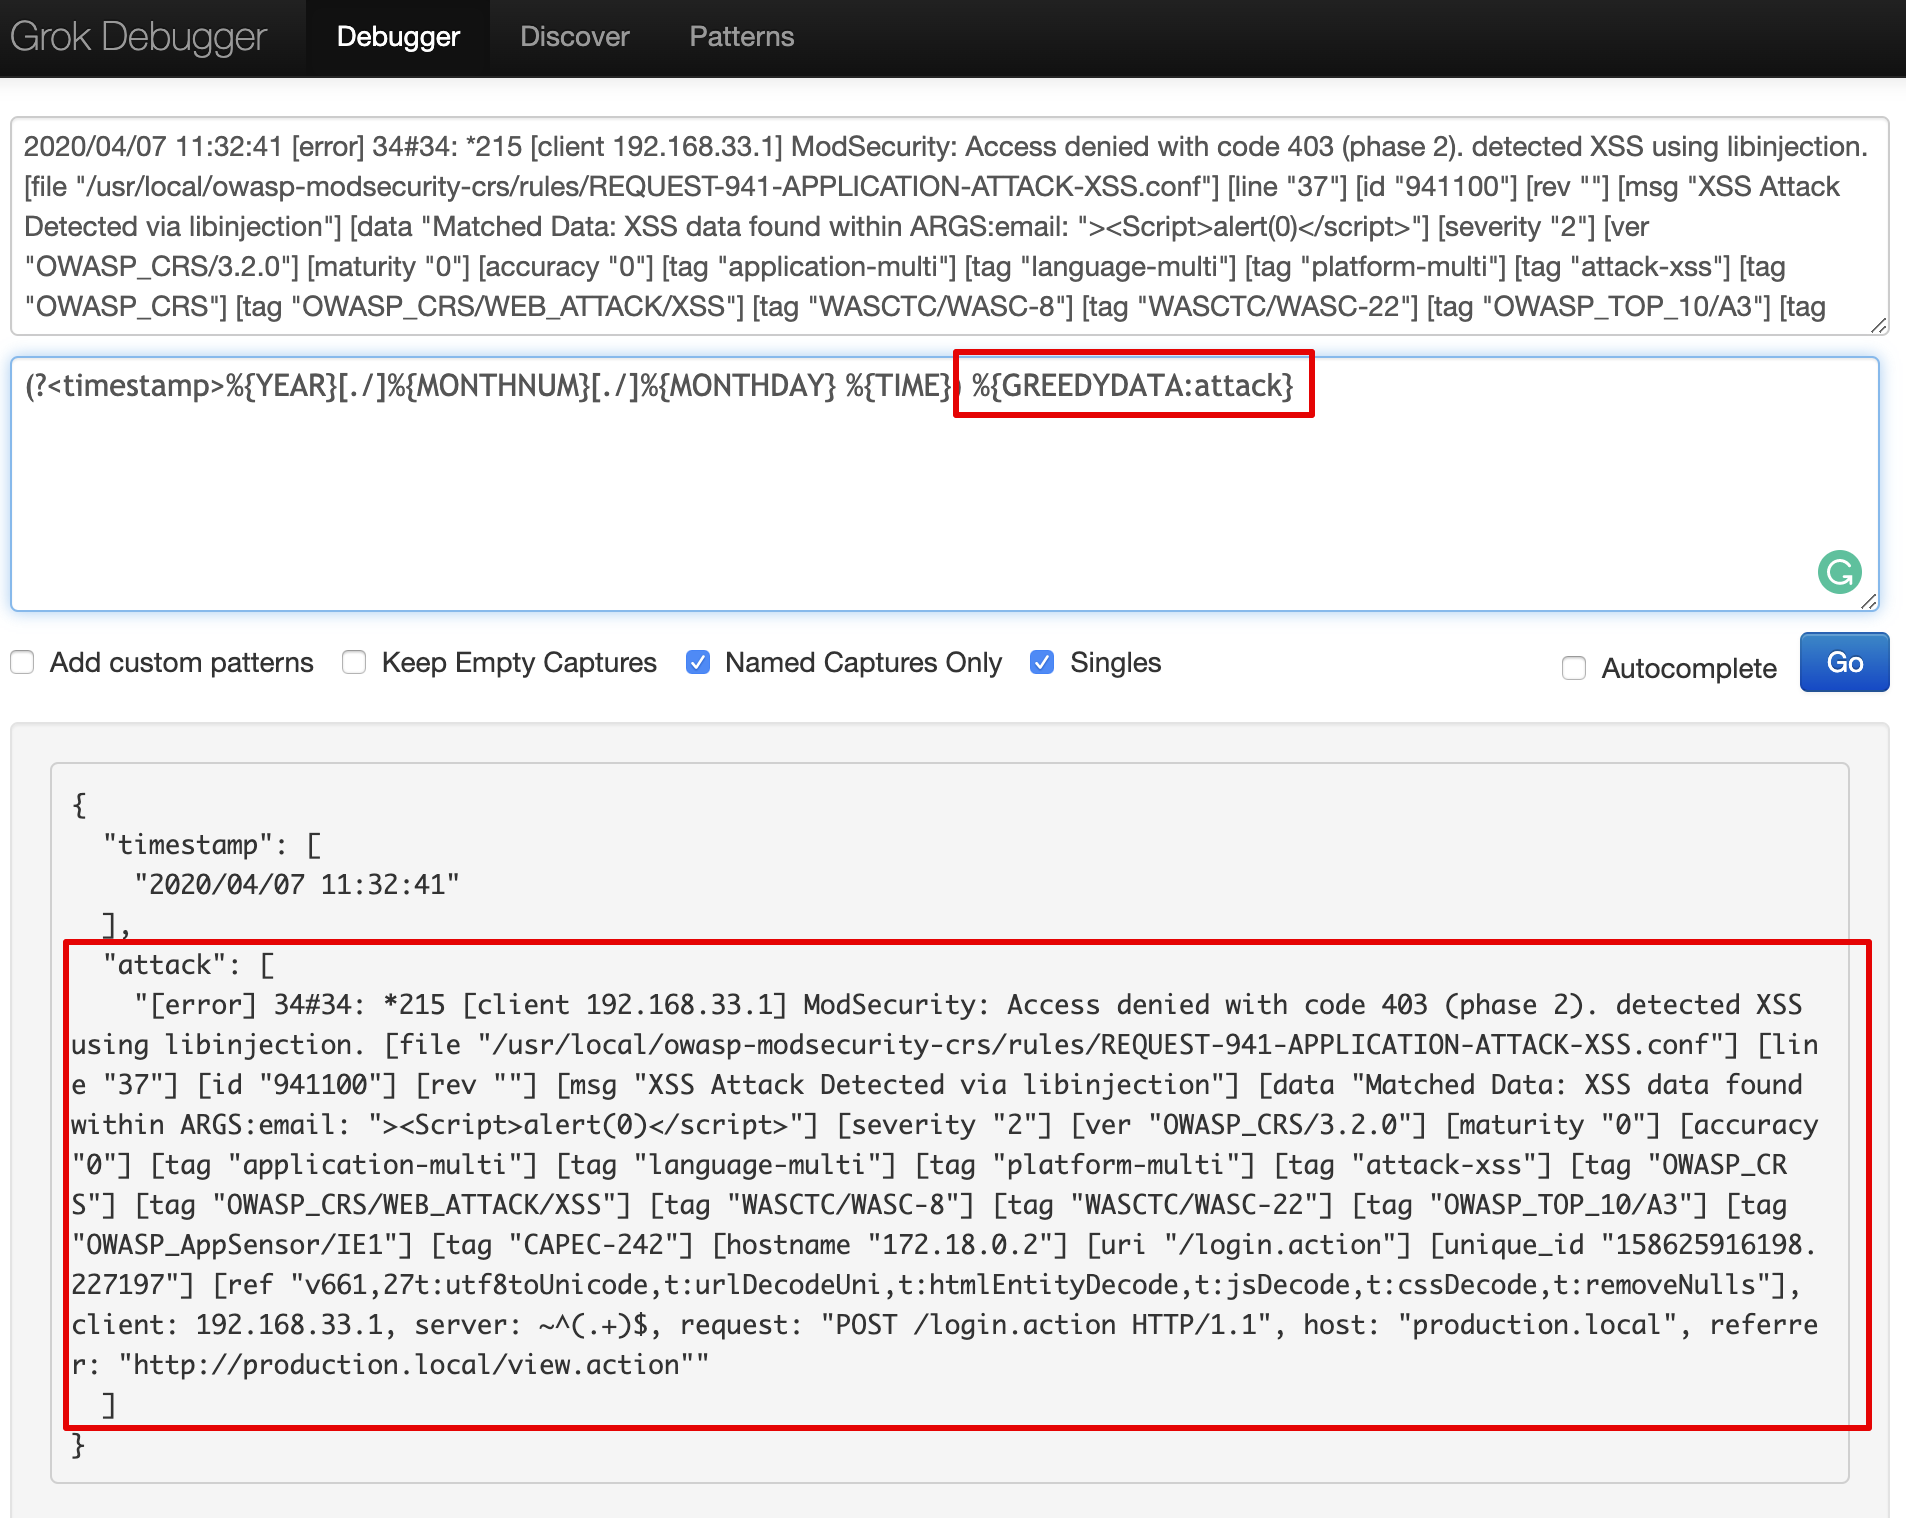
Now we will segregate unformatted data that we can filter, using syntax %{GREEDYDATA:field_name} as an attack field.
GREEDYDATA means “.*” .They expand to the most characters possible, based on the limits placed around it.
We’ve filtered client IP by using Grok filter %{IP:client} which will basically filter IP addresses from logs data.
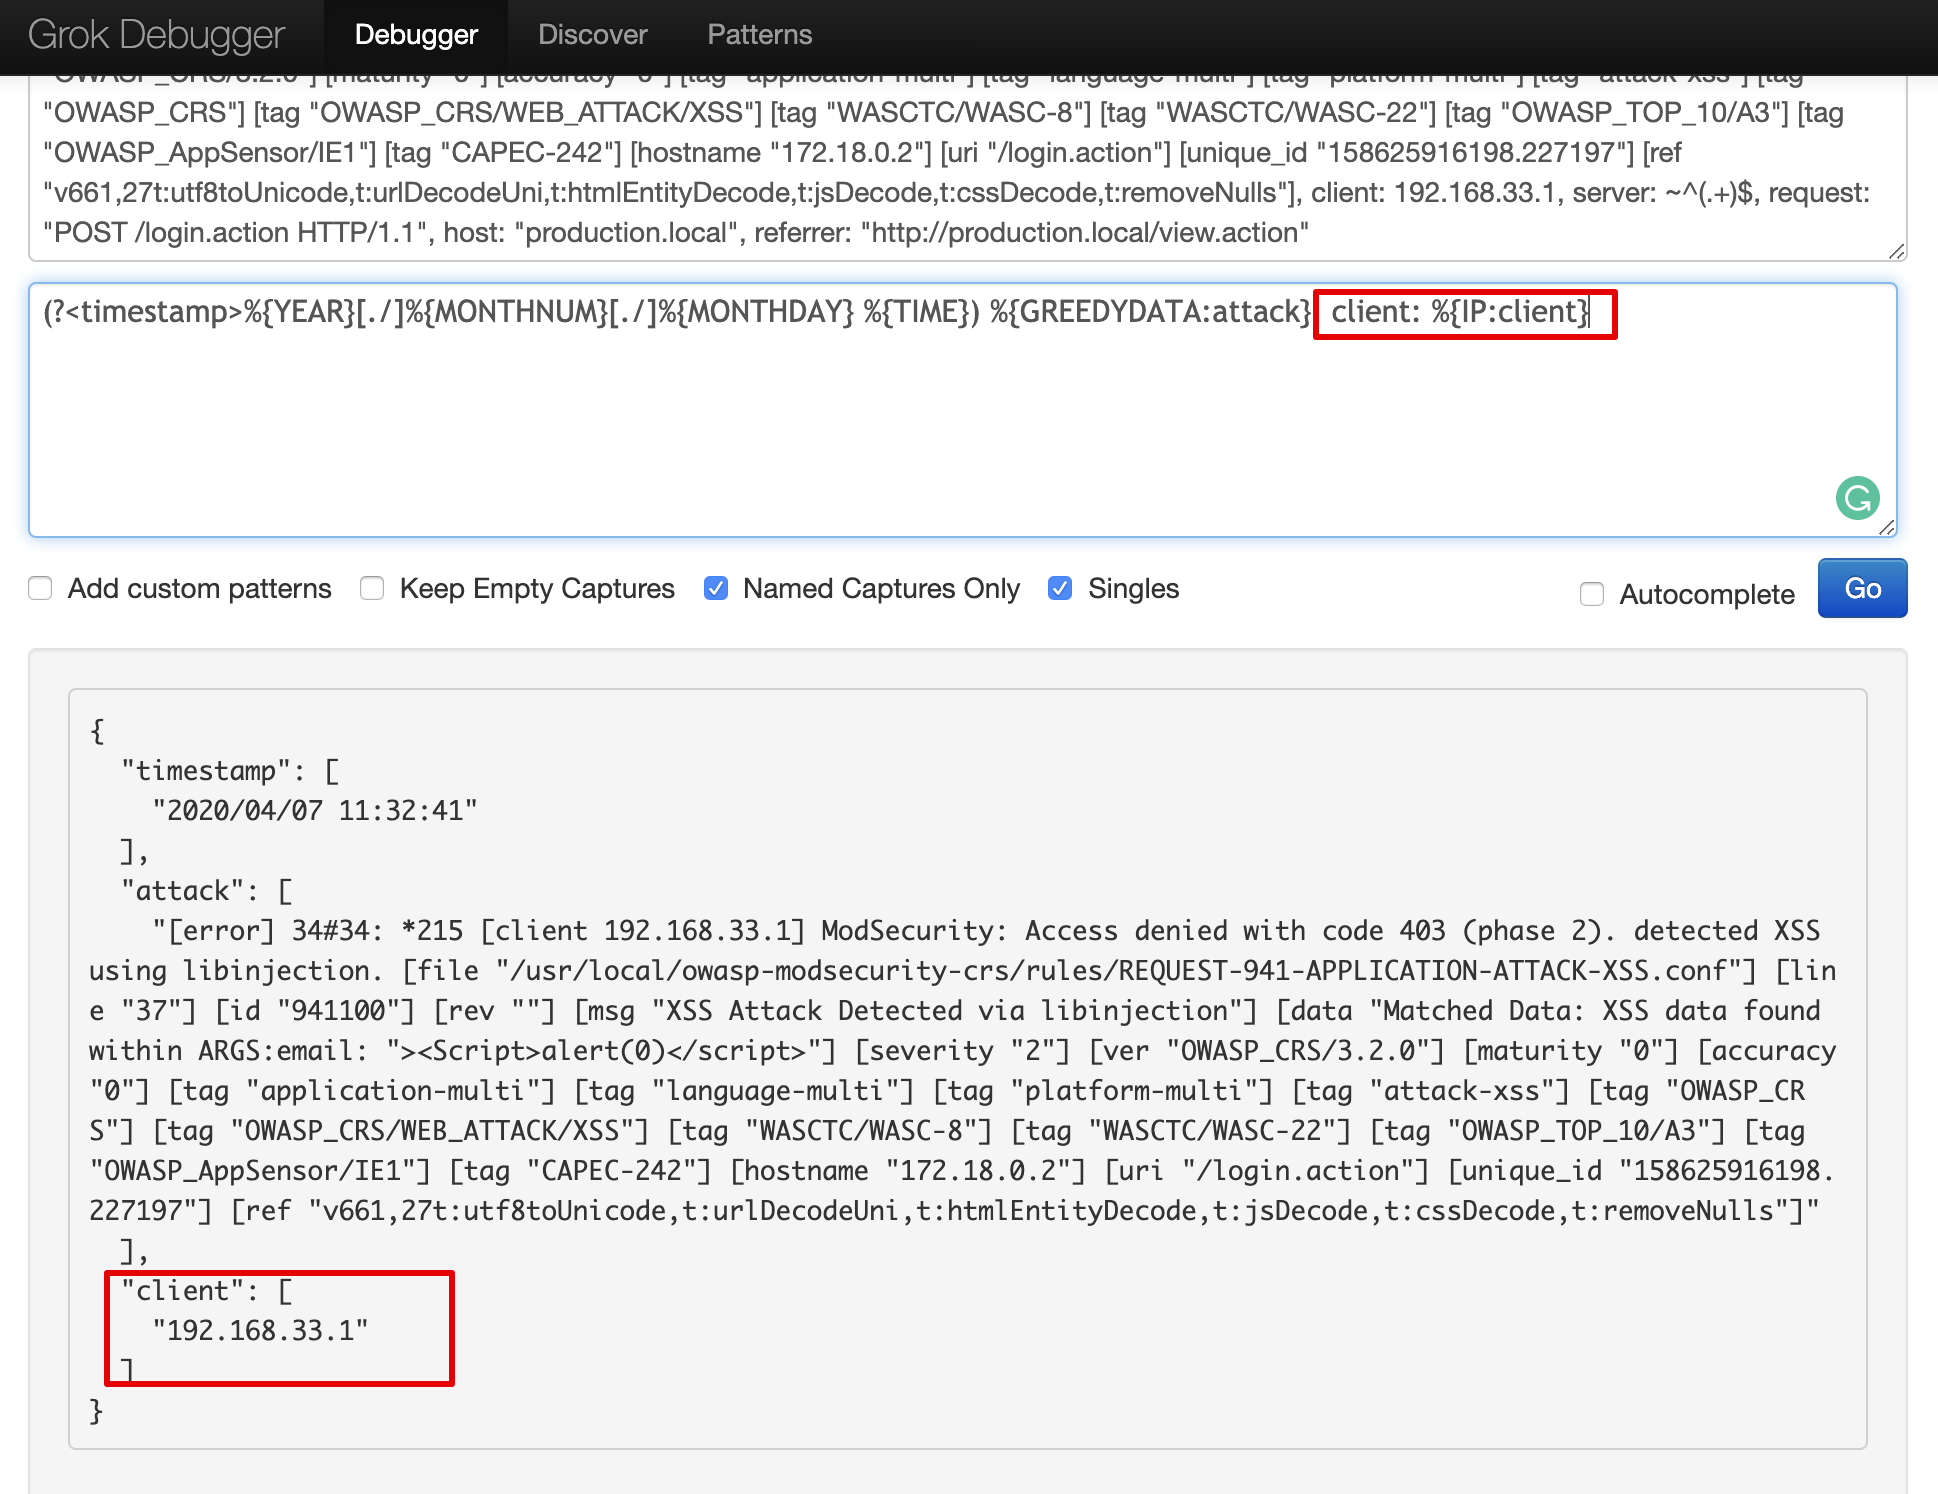
Following is the Grok snippet for the above case that explains segregation of unformatted data as an attack field and to remove the message field.
grok {
     match => { "message" => "(?<timestamp>%{YEAR}[./]%{MONTHNUM}[./]%{MONTHDAY} %{TIME}) %{GREEDYDATA:attack}, client: %{IP:client}, server: %{GREEDYDATA:server}"}
     remove_field => ["message"]
}
Output of grok -
[error] 34#34: *215 [client 192.168.33.1] ModSecurity: Access denied with code 403 (phase 2). detected XSS using libinjection. [file "/usr/local/owasp-modsecurity-crs/rules/REQUEST-941-APPLICATION-ATTACK-XSS.conf"] [line "37"] [id "941100"] [rev ""] [msg "XSS Attack Detected via libinjection"] [data "Matched Data: XSS data found within ARGS:email: "><Script>alert(0)</script>"] [severity "2"] [ver "OWASP_CRS/3.2.0"] [maturity "0"] [accuracy "0"] [tag "application-multi"] [tag "language-multi"] [tag "platform-multi"] [tag "attack-xss"] [tag "OWASP_CRS"] [tag "OWASP_CRS/WEB_ATTACK/XSS"] [tag "WASCTC/WASC-8"] [tag "WASCTC/WASC-22"] [tag "OWASP_TOP_10/A3"] [tag "OWASP_AppSensor/IE1"] [tag "CAPEC-242"] [hostname "172.18.0.2"] [uri "/login.action"] [unique_id "158625916198.227197"] [ref "v661,27t:utf8toUnicode,t:urlDecodeUni,t:htmlEntityDecode,t:jsDecode,t:cssDecode,t:removeNulls"]
Now we need to filter unformatted values from attack field data:
- Attack Name
- Attack Request
- Attack Pattern (payloads)
- Attack URL
Attack Name:
Since we don’t have Grok patterns for other unformatted values, we can use regex expressions to find unformatted values. Below we have used regular expressions to find individual attack names.
You can use this web site for online regex creation, testing and debugging - https://regex101.com/
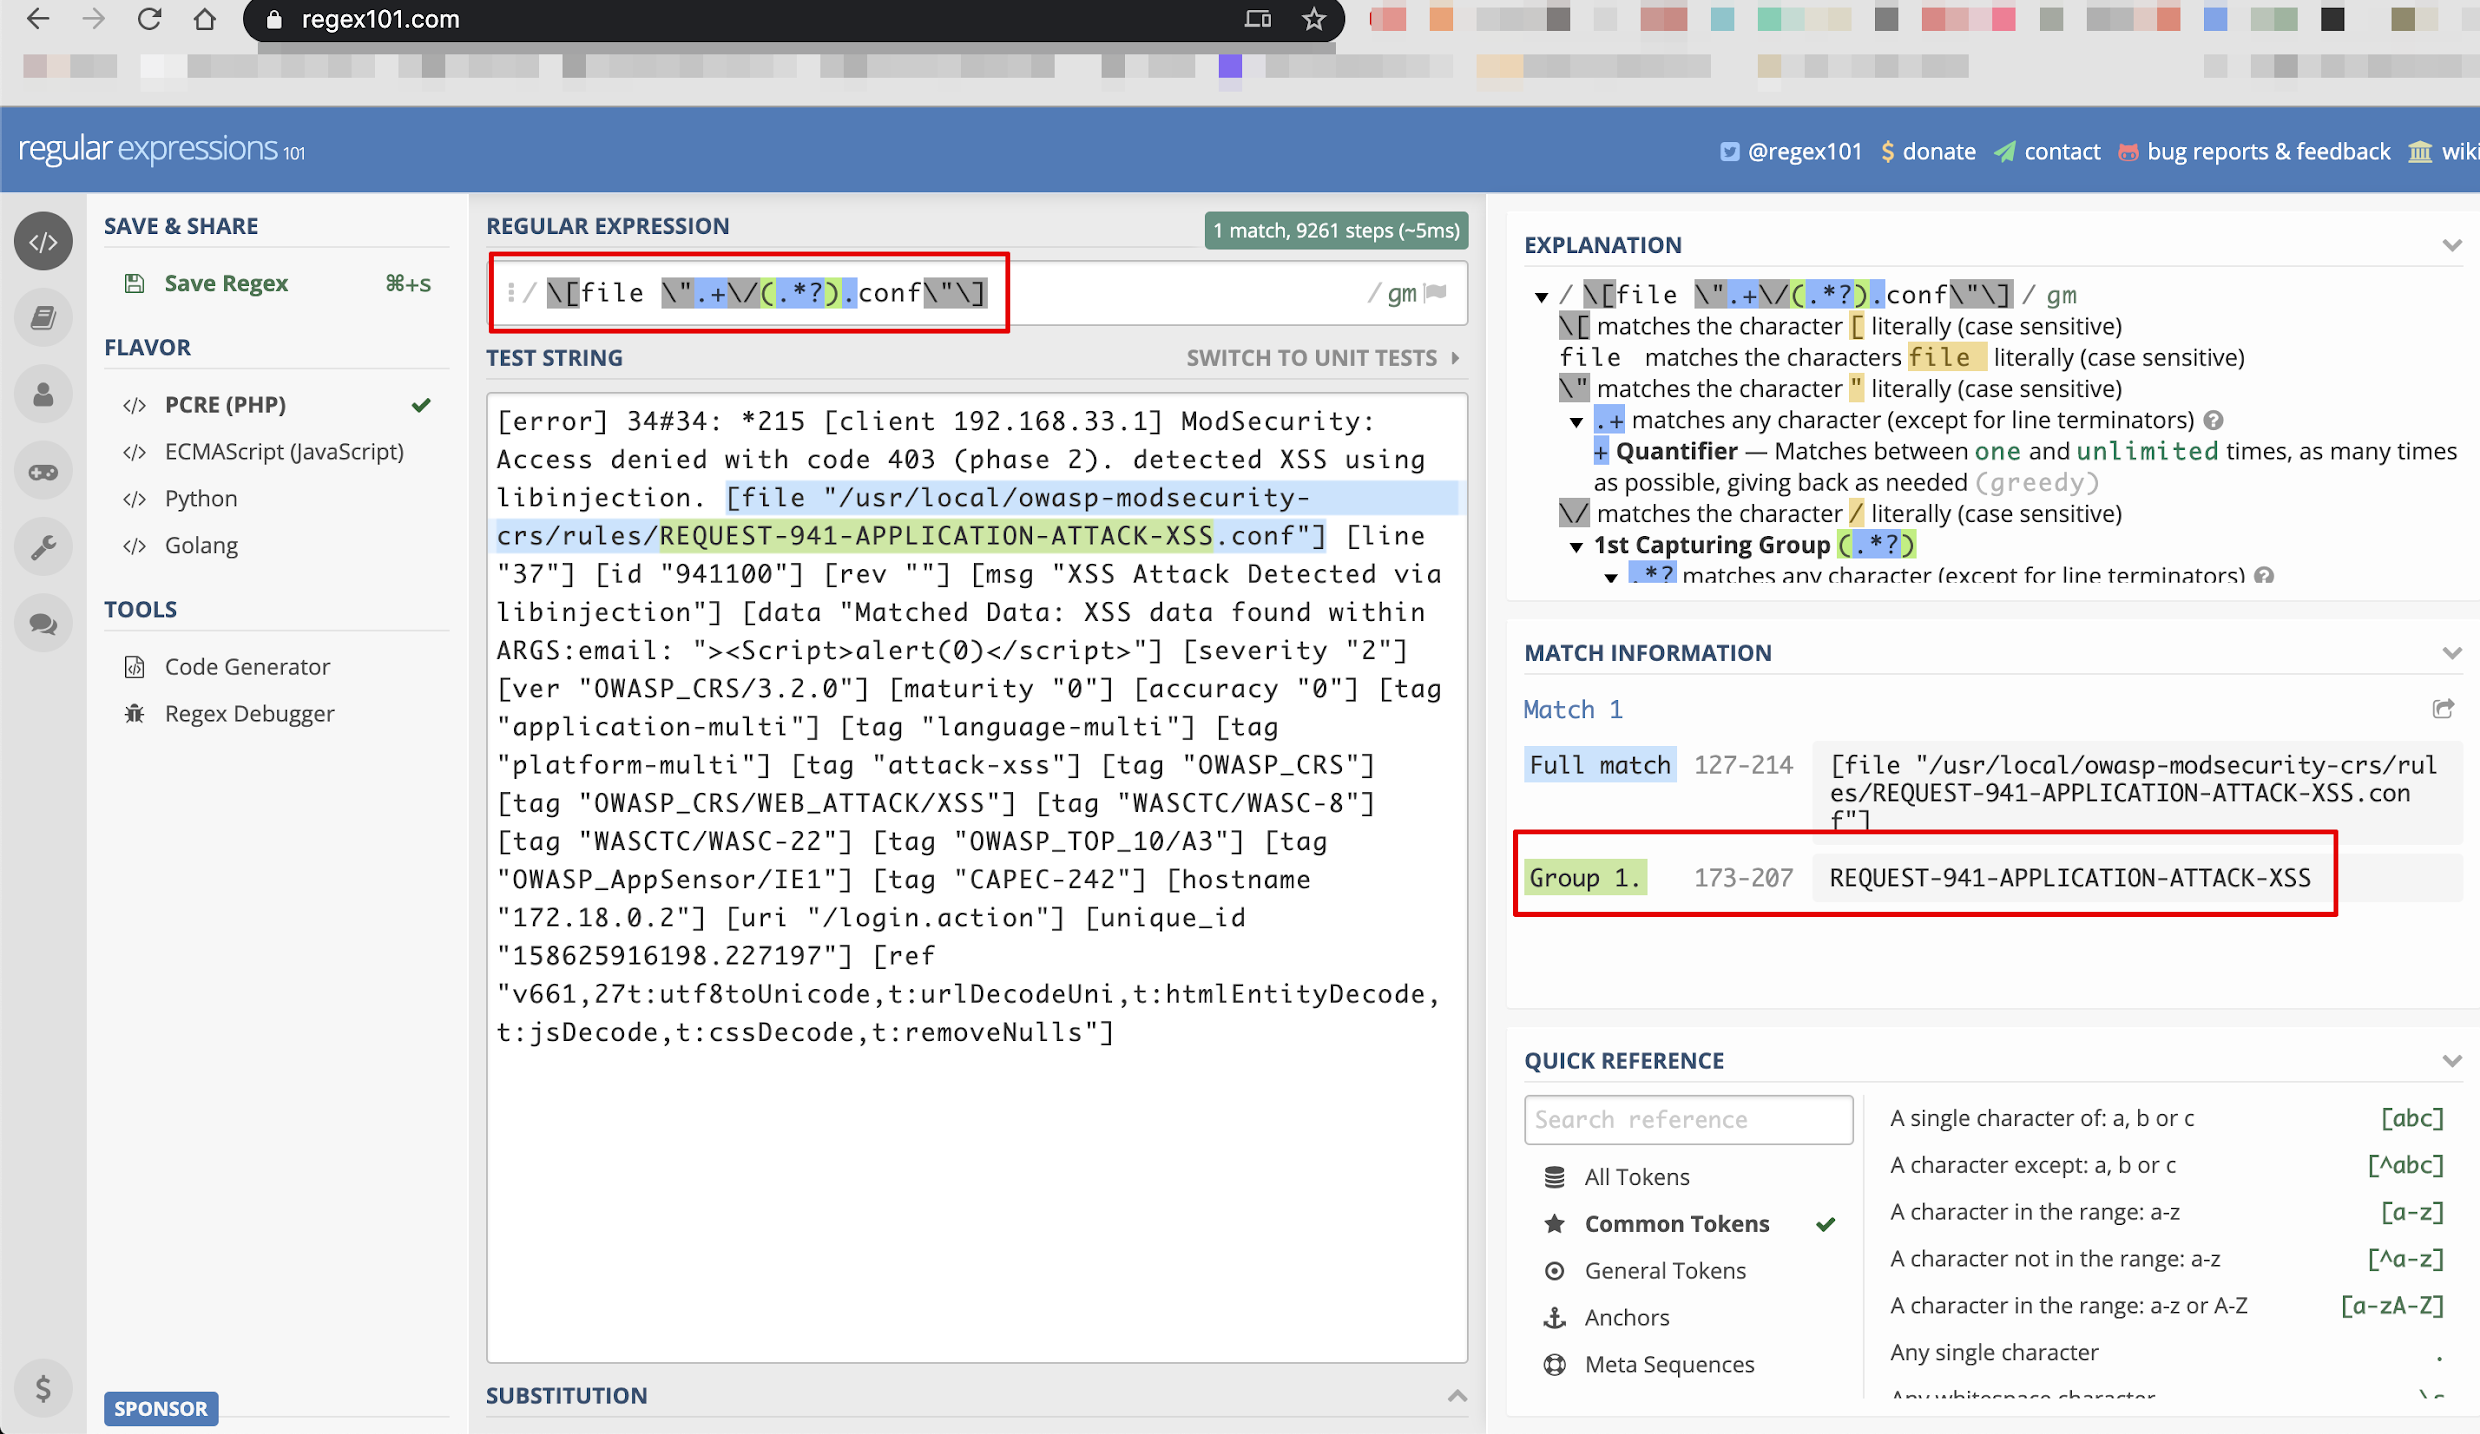
As seen below in Grok debugger, we extracted path value and then stripped name from /usr/local/owasp-modsecurity-crs/rules/REQUEST-941-APPLICATION-ATTACK-XSS.conf path value as REQUEST-941-APPLICATION-ATTACK-XSS
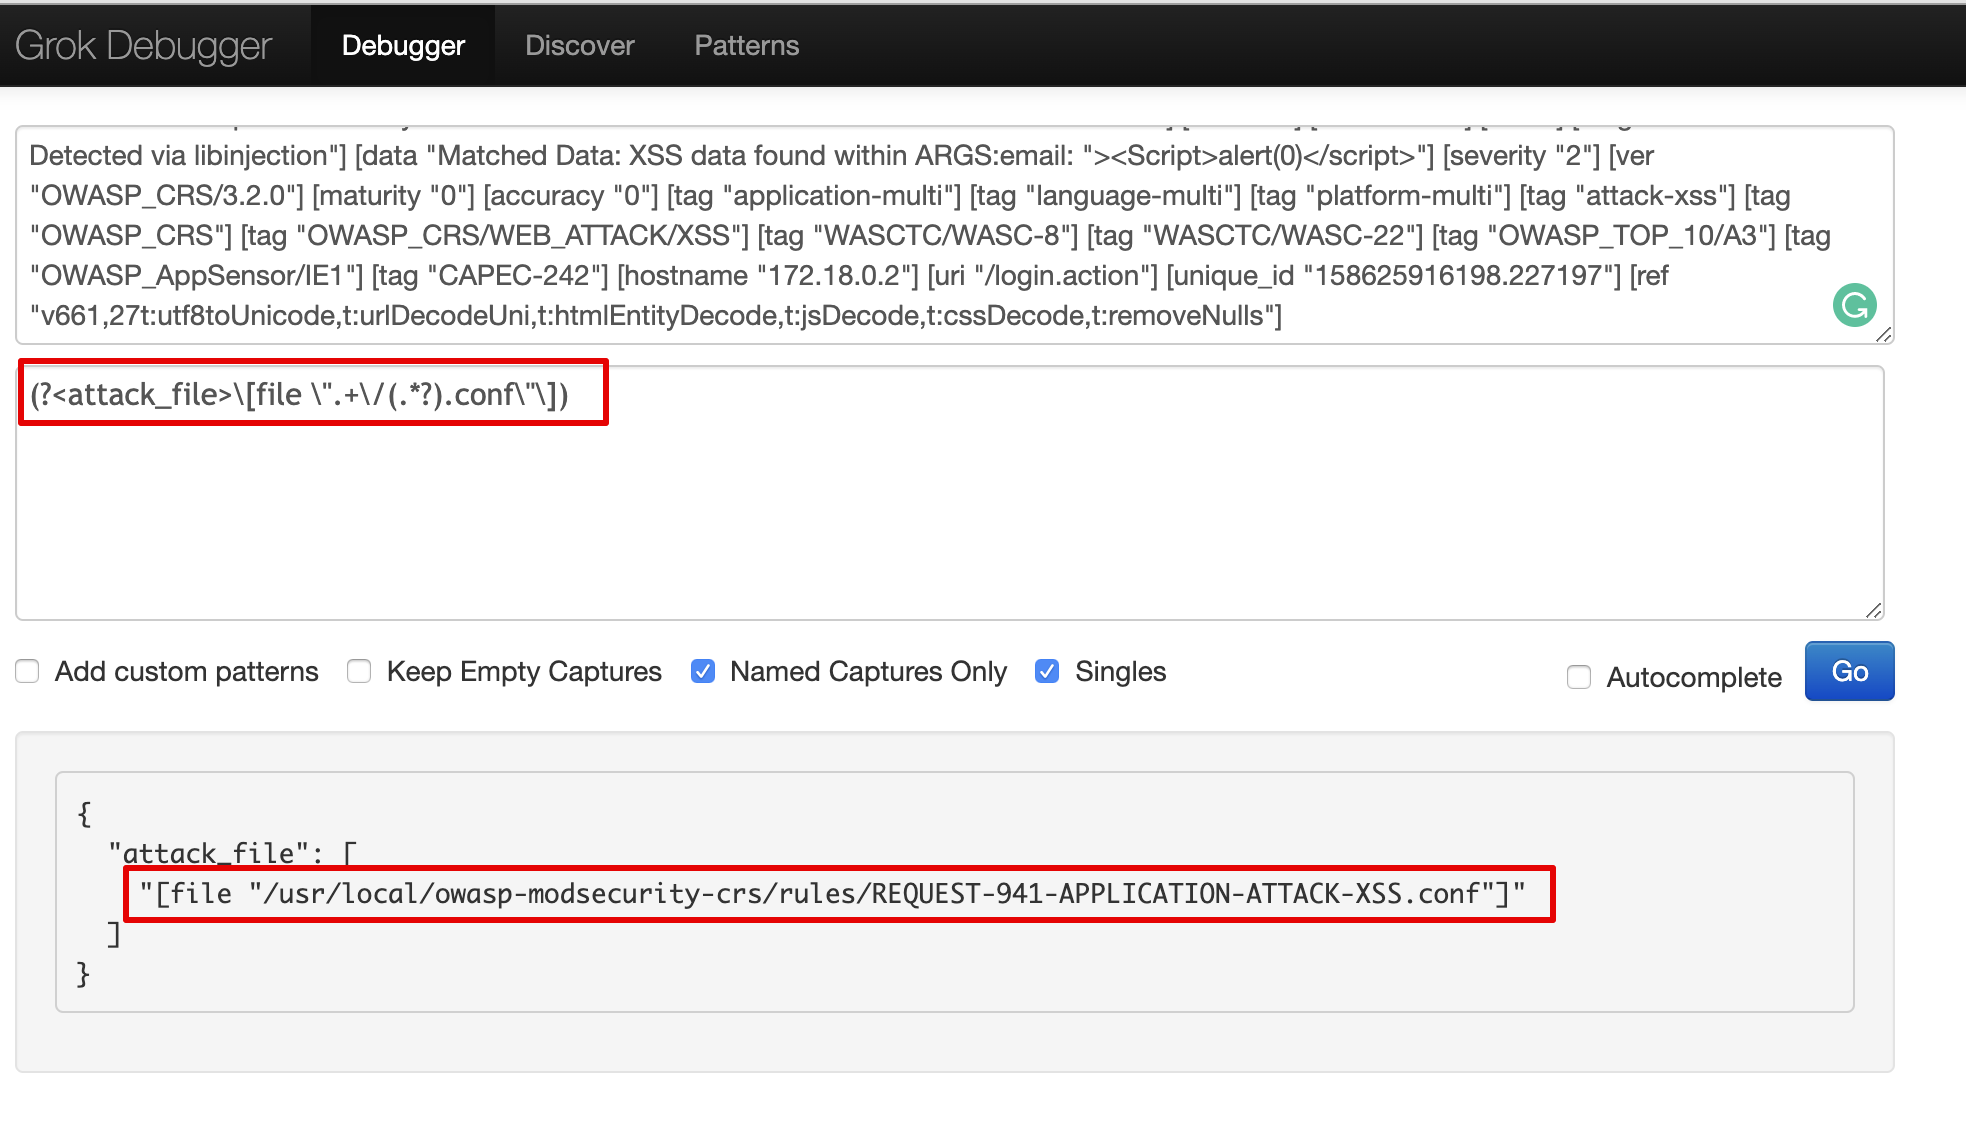
grok {
match => {"attack" => "(?<attack_file>\[file \".+\/(.*?).conf\"\])"}
}
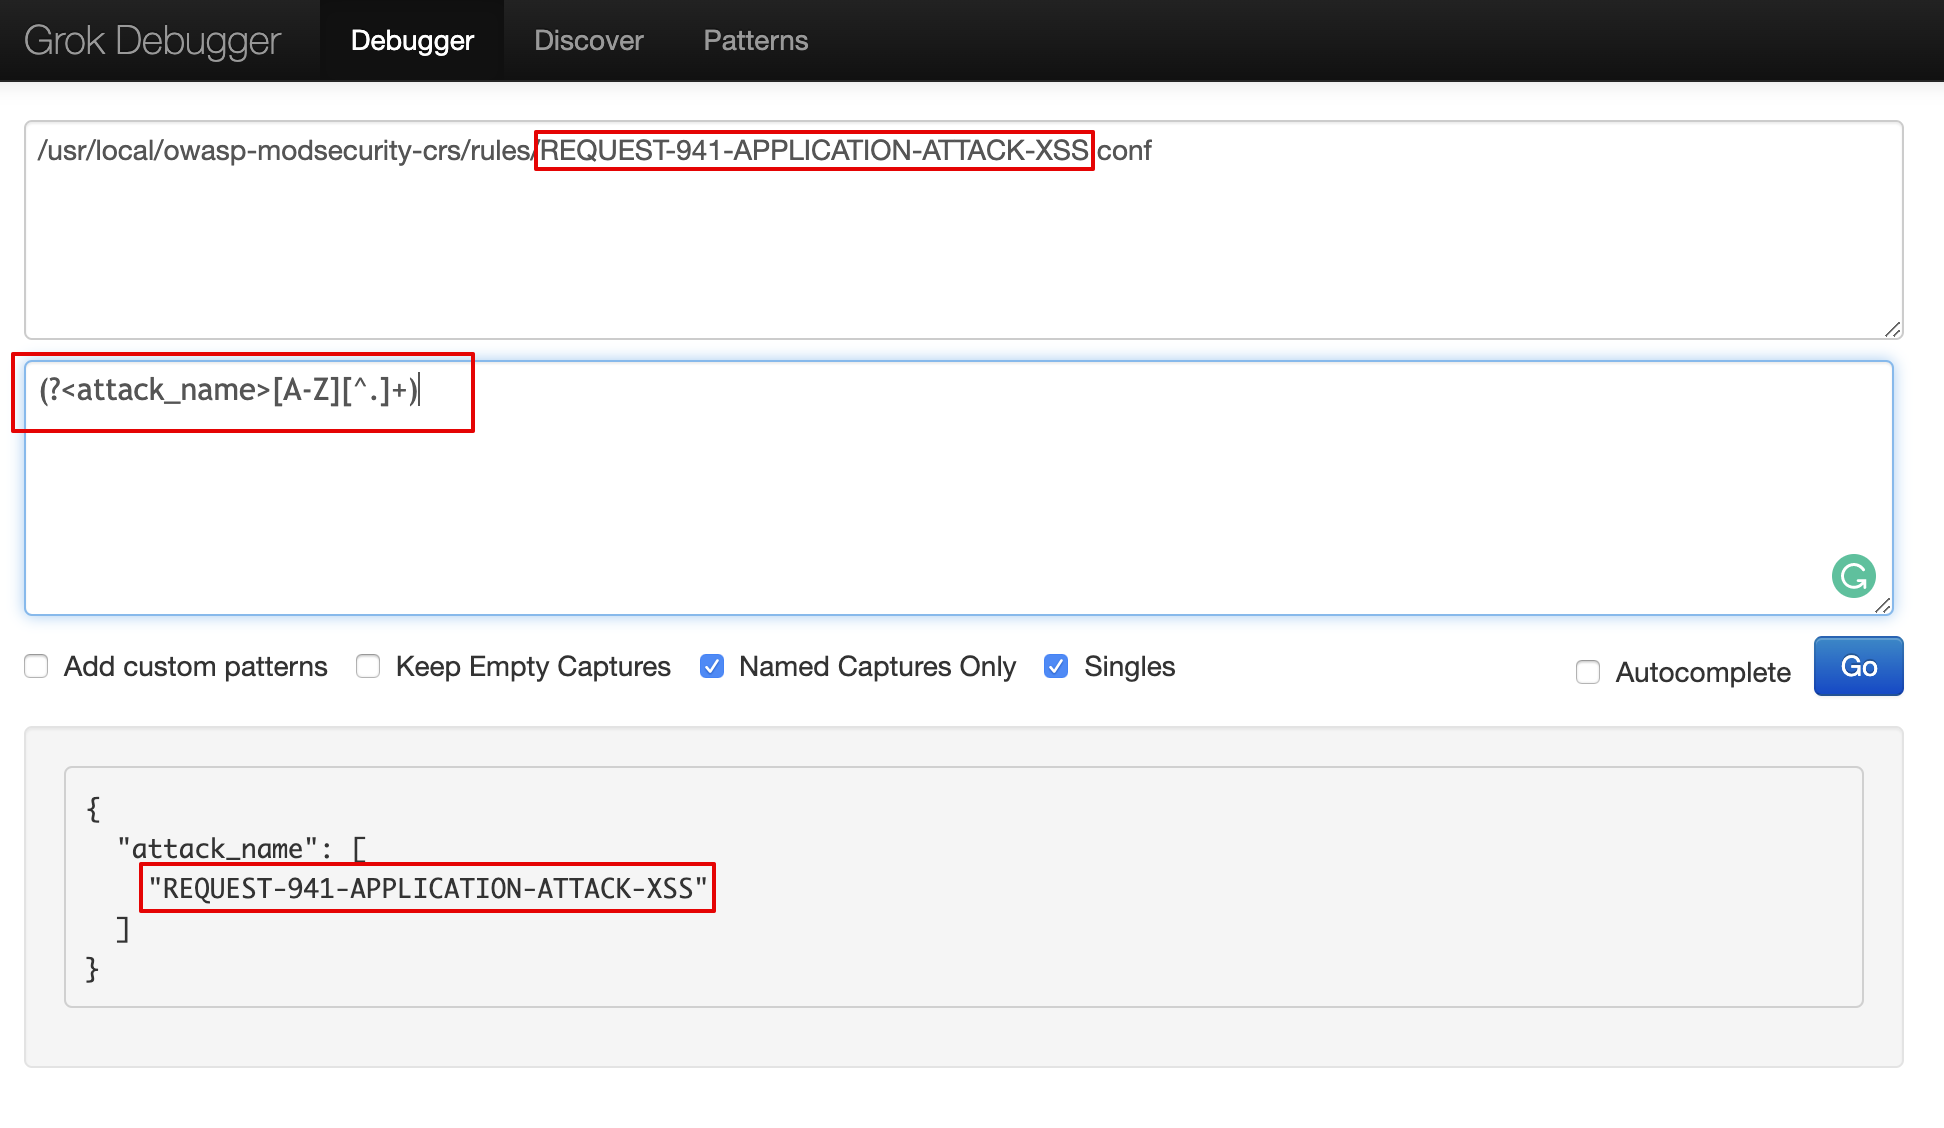
grok {
match => {"attack_file" => "(?<attack_name>[A-Z][^.]+)"}
remove_field => ["attack_file"]
}Other Values
Similarly we stripped other values from the attack field data and created a full Logstash configuration file that contained all segregated values.
Full Logstash configuration
input
{
   beats
   {
       ssl => false
       port => 5000
       codec => "json"
   }
}
filter {
   grok {
       match => { "message" => "(?<timestamp>%{YEAR}[./]%{MONTHNUM}[./]%{MONTHDAY} %{TIME}) \[%{LOGLEVEL:severity}\] %{POSINT:pid}#%{NUMBER:threadid}\: \*%{NUMBER:connectionid} %{GREEDYDATA:attack}, client: %{IP:client}, server: %{GREEDYDATA:server}"}
       remove_field => ["message"]
 }
   grok {
       match => {"attack" => "(?<attack_file>\[file \".+\/(.*?).conf\"\])"}
 }
 grok {
       match => {"attack_file" => "(?<attack_name>[A-Z][^.]+)"}
       remove_field => ["attack_file"]
 }
   grok {
       match => {"attack" => "(?<attack_message>\[msg \"(.*?)\"\])"}
   }
   grok {
       match => {"attack" => "(?<attack_data>\[data \"(.*?)\"\])"}
   }
   grok {
       match => {"attack" => "(?<attack_uri>\[uri \"(.*?)\"\])"}
       remove_field => ["attack"]
   }
   grok {
       match => {"attack_uri" => "(?<attack_url>[/].+\")"}
   }
   if [message] =~ "\A\{.+\}\z" {
       json {
         source => "message"
         target => "httpRequest"
       }
       mutate {
         remove_field => [ "json", "message" ]
       }
   }
   mutate {
         remove_field => [ "json", "agent" ]
         remove_field => [ "json", "tags" ]
         remove_field => [ "json", "thread_name" ]
   }
}
output {
   elasticsearch {
     hosts => ["{{elasticsearch_server}}"]
     manage_template => false
     index => "logstash-%{+YYYY.MM.dd}"
  }
}
As you can see, now there are multiple fields in the Elasticsearch index and it can filter individual values.
Attack Dashboard
Now let’s create a dashboard including all the attacks count and patterns. We can also visualize it as a pie chart or anything according to our requirement.
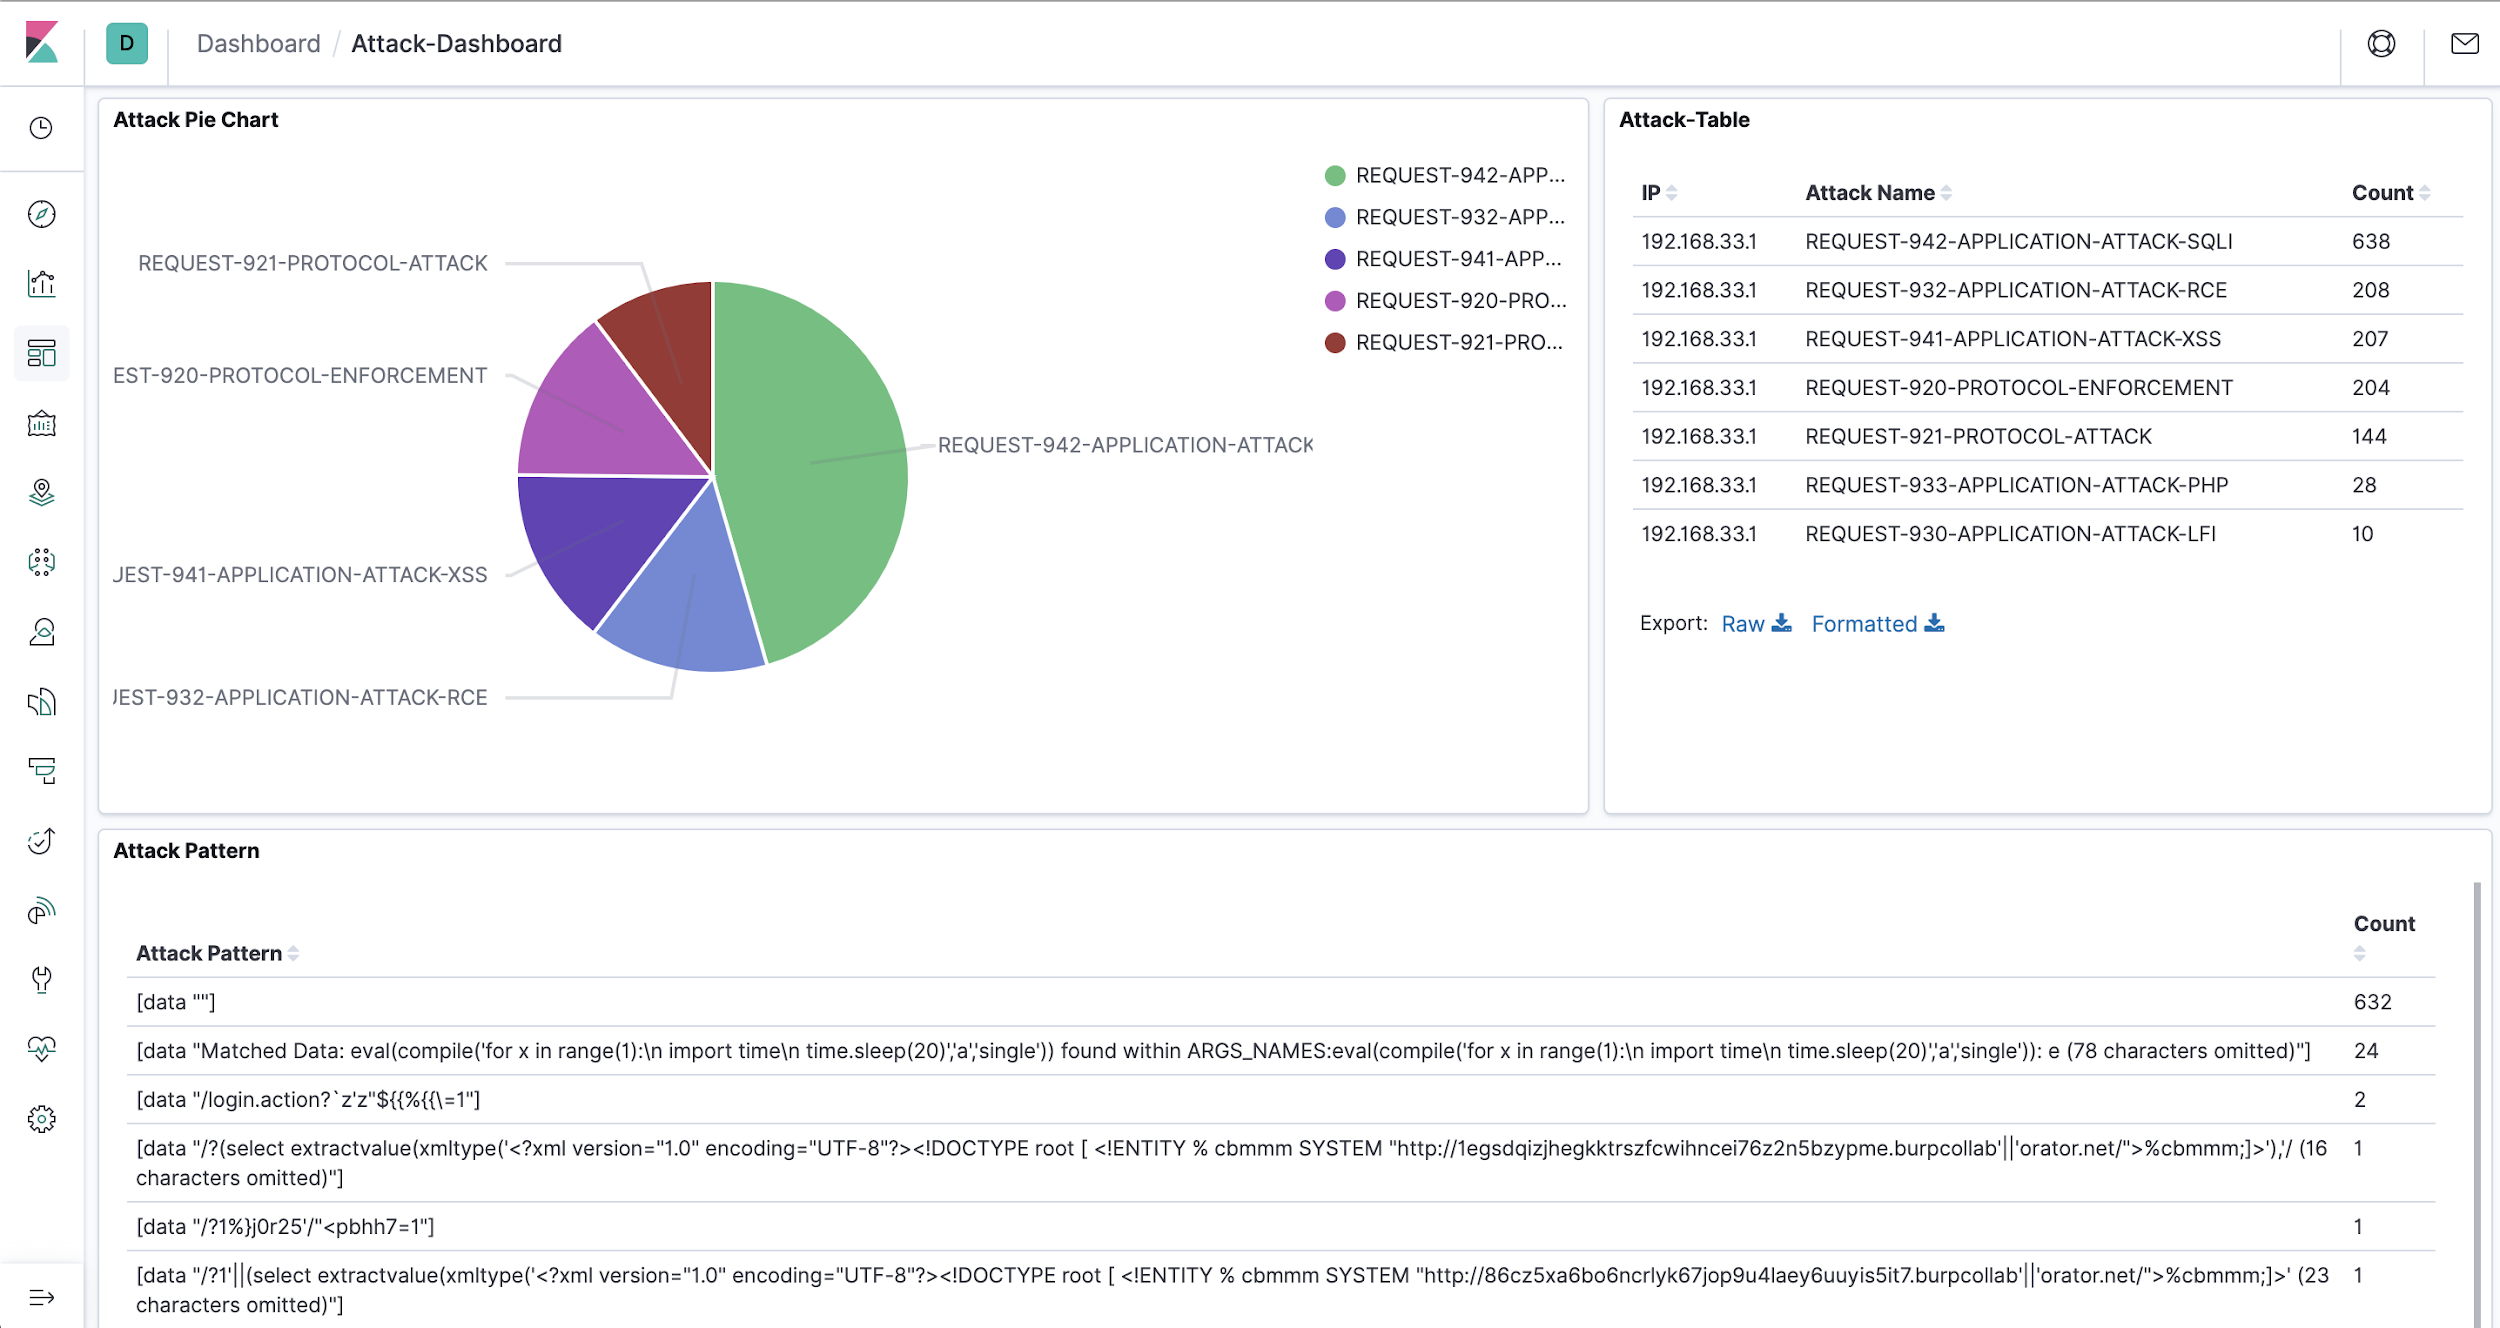
This summarises how we can set up a continuous security monitoring and alerting system using ModSecurity framework with room for additional fine tuning. Visualization of the data can be achieved and the dashboards can be customized as per the requirement.
Marketing
If you would like to experience this hands-on, we cover topics like these along with other defensive strategies in our AppSecOps and DevSecOps classes. Get in touch if you would like to be a part of these training sessions. We also help enterprises implement DevSecOps practices.
References:
- https://resources.infosecinstitute.com/topic/analyzing-mod-security-logs/
- https://hackernoon.com/structuring-unstructured-data-with-grok-bcdbb240fcd1
- https://www.elastic.co/guide/en/logstash/current/plugins-filters-grok.html
- https://logz.io/blog/filebeat-vs-logstash/
- https://owasp.org/www-project-top-ten/2017/A10_2017-Insufficient_Logging%2526Monitoring.html
- https://www.elastic.co/guide/en/logstash/current/plugins-filters-grok.html#_regular_expressions